

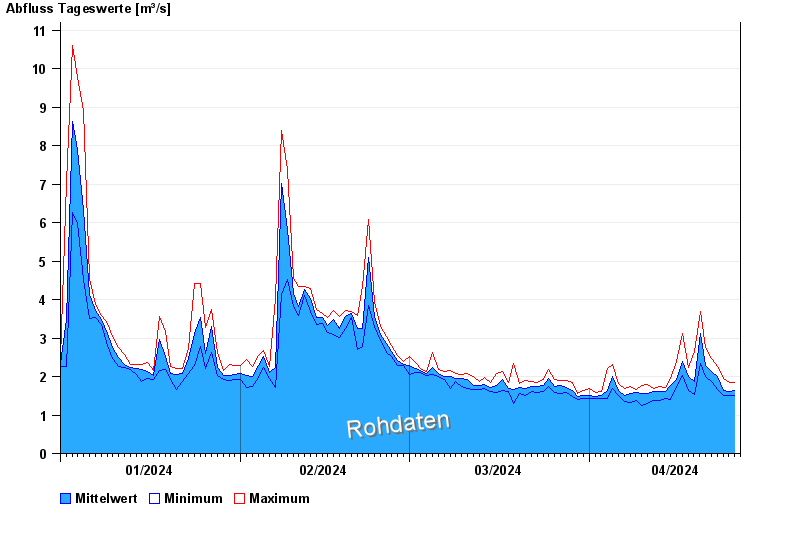
Chart of year Lohma Q / Zottbach
Discharge from 01.01.2024 to 26.04.2024
note
Abflusswerte sind Werte der Ultraschallanlage!
| Date | Mean value [m³/s] | Maximum [m³/s] | Minimum [m³/s] |
|---|---|---|---|
| 26.04.2024 | 1.63 | 1.85 | 1.52 |
| 25.04.2024 | 1.62 | 1.85 | 1.5 |
| 24.04.2024 | 1.65 | 1.96 | 1.52 |
| 23.04.2024 | 1.99 | 2.26 | 1.67 |
| 22.04.2024 | 2.12 | 2.47 | 1.86 |
| 21.04.2024 | 2.29 | 2.75 | 1.99 |
| 20.04.2024 | 3.13 | 3.68 | 2.35 |
© Bayerisches Landesamt für Umwelt 2024