
- Start >
- Rivers >
- Discharge >
- Bayern >
- Leutstetten >
- Chart of year

Chart of year Leutstetten / Würm
Discharge from 01.01.2023 to 31.12.2023
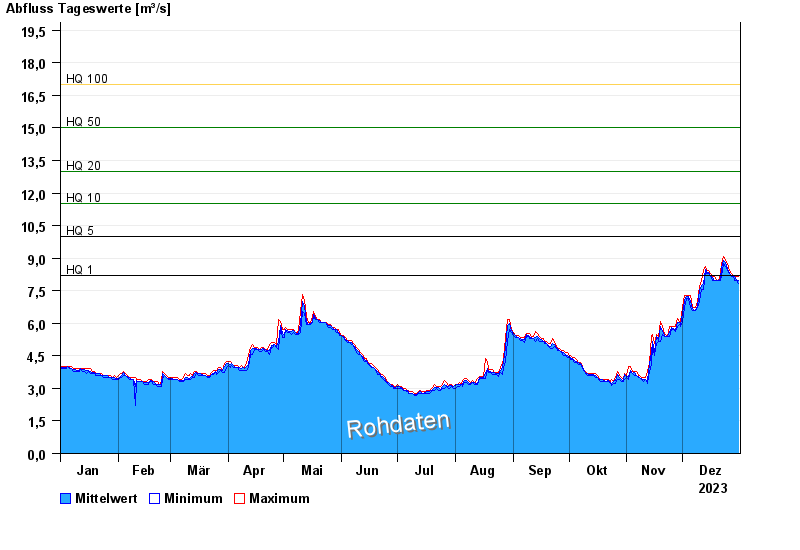
- HQ1 8,2 m³/s
- HQ5 10 m³/s
- HQ10 11,5 m³/s
- HQ20 13 m³/s
- HQ50 15 m³/s
- HQ100 17 m³/s
| Date | Mean value [m³/s] | Maximum [m³/s] | Minimum [m³/s] |
|---|---|---|---|
| 31.12.2023 | 7.9 | 8.05 | 7.83 |
| 30.12.2023 | 7.96 | 8.05 | 7.9 |
| 29.12.2023 | 8.05 | 8.09 | 8.01 |
| 28.12.2023 | 8.09 | 8.15 | 8.06 |
| 27.12.2023 | 8.16 | 8.24 | 8.12 |
| 26.12.2023 | 8.28 | 8.38 | 8.2 |
| 25.12.2023 | 8.48 | 8.7 | 8.34 |
© Bayerisches Landesamt für Umwelt 2025