
- Start >
- Rivers >
- Discharge >
- Bayern >
- Lenggries Q >
- Chart of year

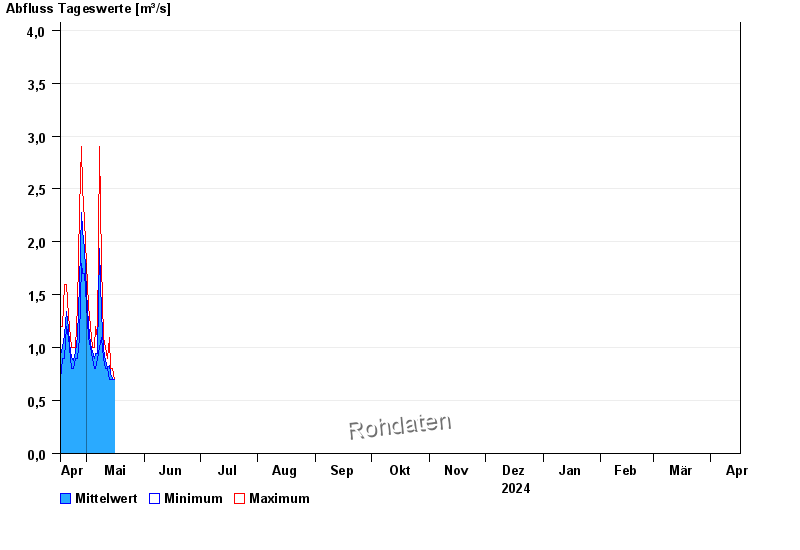
Chart of year Lenggries Q / Arzbach
Discharge from 17.04.2024 to 16.04.2025
 Für diesen Pegel sind keine historische Ereignisse hinterlegt.
| Date | Mean value [m³/s] | Maximum [m³/s] | Minimum [m³/s] |
|---|---|---|---|
| 29.04.2024 | 2.06 | 2.5 | 1.7 |
| 28.04.2024 | 2.28 | 2.9 | 1.8 |
| 27.04.2024 | 1.6 | 2.3 | 1.1 |
| 26.04.2024 | 1.11 | 1.4 | 0.9 |
| 25.04.2024 | 0.95 | 1 | 0.9 |
| 24.04.2024 | 0.875 | 1 | 0.8 |
| 23.04.2024 | 0.907 | 1 | 0.8 |
© Bayerisches Landesamt für Umwelt 2024