

Chart of year Langenau / Langenaubach
Discharge from 01.01.2024 to 01.05.2024
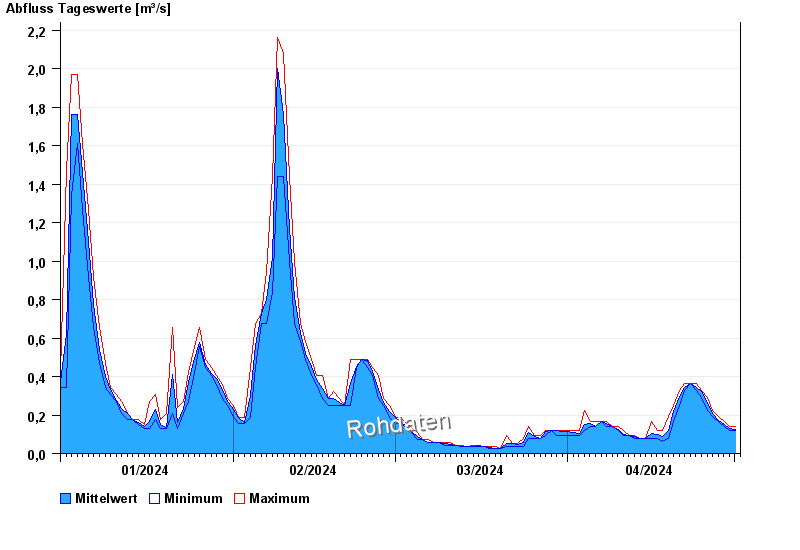
| Date | Mean value [m³/s] | Maximum [m³/s] | Minimum [m³/s] |
|---|---|---|---|
| 01.05.2024 | 0.124 | 0.138 | 0.117 |
| 30.04.2024 | 0.131 | 0.138 | 0.117 |
| 29.04.2024 | 0.151 | 0.164 | 0.138 |
| 28.04.2024 | 0.172 | 0.19 | 0.164 |
| 27.04.2024 | 0.207 | 0.221 | 0.19 |
| 26.04.2024 | 0.263 | 0.289 | 0.221 |
| 25.04.2024 | 0.32 | 0.326 | 0.289 |
© Bayerisches Landesamt für Umwelt 2024