

Chart of total period Langenau / Langenaubach
Discharge from 01.11.1964 to 26.04.2024
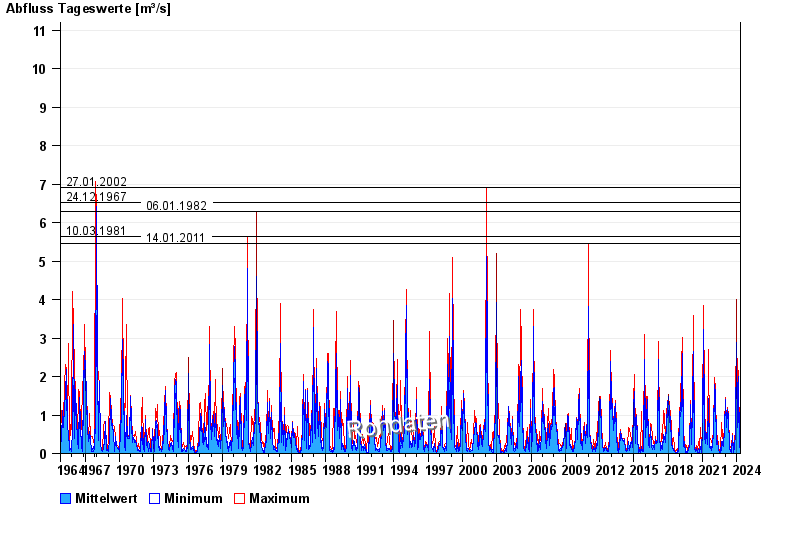
- 27.01.2002 Abfluss: 6,9 m³/s
- 24.12.1967 Abfluss: 6,52 m³/s
- 06.01.1982 Abfluss: 6,28 m³/s
- 10.03.1981 Abfluss: 5,65 m³/s
- 14.01.2011 Abfluss: 5,47 m³/s
| Date | Mean value [m³/s] | Maximum [m³/s] | Minimum [m³/s] |
|---|---|---|---|
| 26.04.2024 | 0.283 | 0.289 | 0.251 |
| 25.04.2024 | 0.32 | 0.326 | 0.289 |
| 24.04.2024 | 0.343 | 0.363 | 0.326 |
| 23.04.2024 | 0.363 | 0.363 | 0.363 |
| 22.04.2024 | 0.341 | 0.363 | 0.326 |
| 21.04.2024 | 0.295 | 0.326 | 0.251 |
| 20.04.2024 | 0.22 | 0.251 | 0.164 |
© Bayerisches Landesamt für Umwelt 2024