
- Start >
- Rivers >
- Discharge >
- Bayern >
- Kreppendorf >
- Chart of year

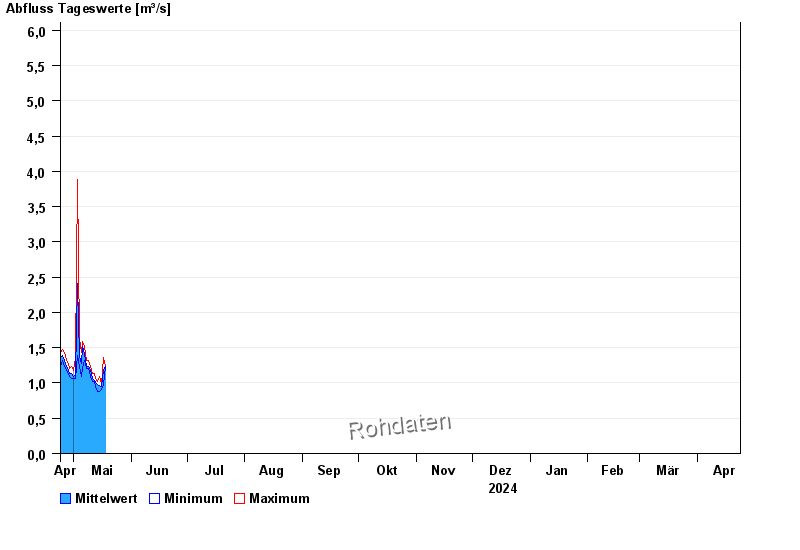
Chart of year Kreppendorf / Zenn
Discharge from 24.04.2024 to 23.04.2025
- 21.12.1993 Abfluss: 102 m³/s
- 09.07.2021 Abfluss: 95,9 m³/s
- 21.03.2002 Abfluss: 67,5 m³/s
- 24.05.1978 Abfluss: 66,3 m³/s
- 29.10.1998 Abfluss: 65,5 m³/s
| Date | Mean value [m³/s] | Maximum [m³/s] | Minimum [m³/s] |
|---|---|---|---|
| 18.05.2024 | 1.24 | 1.24 | 1.24 |
| 17.05.2024 | 1.18 | 1.36 | 0.98 |
| 16.05.2024 | 0.948 | 0.98 | 0.908 |
| 15.05.2024 | 0.965 | 1.09 | 0.872 |
| 14.05.2024 | 0.973 | 1.02 | 0.872 |
| 13.05.2024 | 1.01 | 1.06 | 0.943 |
| 12.05.2024 | 1.04 | 1.13 | 1.02 |
© Bayerisches Landesamt für Umwelt 2024