
- Start >
- Rivers >
- Discharge >
- Bayern >
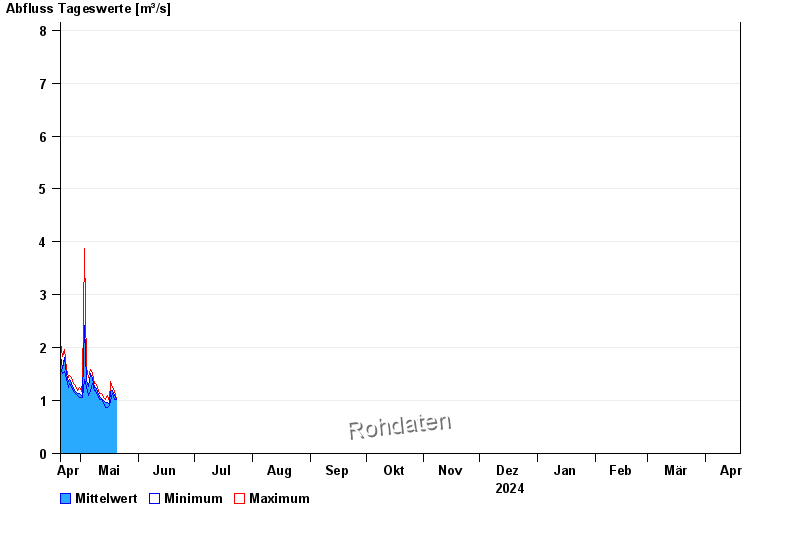
- Kreppendorf >
- Chart of year

Chart of year Kreppendorf / Zenn
Discharge from 20.04.2024 to 19.04.2025
- HQ1 23 m³/s
- HQ2 36 m³/s
- HQ5 49 m³/s
- HQ10 63 m³/s
- HQ20 77 m³/s
- HQ50 98 m³/s
- HQ100 115 m³/s
| Date | Mean value [m³/s] | Maximum [m³/s] | Minimum [m³/s] |
|---|---|---|---|
| 03.05.2024 | 1.41 | 1.43 | 1.39 |
| 02.05.2024 | 1.12 | 1.36 | 1.06 |
| 01.05.2024 | 1.09 | 1.17 | 1.06 |
| 30.04.2024 | 1.13 | 1.24 | 1.06 |
| 29.04.2024 | 1.13 | 1.2 | 1.09 |
| 28.04.2024 | 1.18 | 1.28 | 1.13 |
| 27.04.2024 | 1.23 | 1.32 | 1.17 |
© Bayerisches Landesamt für Umwelt 2024