
- Start >
- Rivers >
- Discharge >
- Bayern >
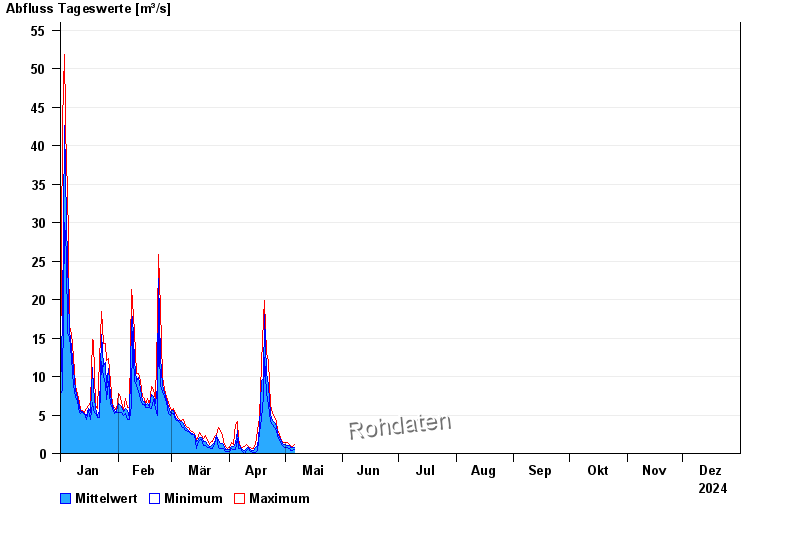
- Kothmaißling >
- Chart of year

Chart of year Kothmaißling / Chamb
Discharge from 01.01.2024 to 31.12.2024
note
Beeinflussung durch Buhneneinbau unterhalb vom Pegel
| Date | Mean value [m³/s] | Maximum [m³/s] | Minimum [m³/s] |
|---|---|---|---|
| 31.05.2024 | 7.99 | 9.93 | 5.59 |
| 30.05.2024 | 6.22 | 7.48 | 5.32 |
| 29.05.2024 | 9.2 | 12.4 | 7.65 |
| 28.05.2024 | 17.4 | 24.3 | 5.45 |
| 27.05.2024 | 5.52 | 6.15 | 5.18 |
| 26.05.2024 | 6.29 | 7.65 | 5.73 |
| 25.05.2024 | 5.55 | 6.44 | 3.43 |
© Bayerisches Landesamt für Umwelt 2024