
- Start >
- Rivers >
- Discharge >
- Bayern >
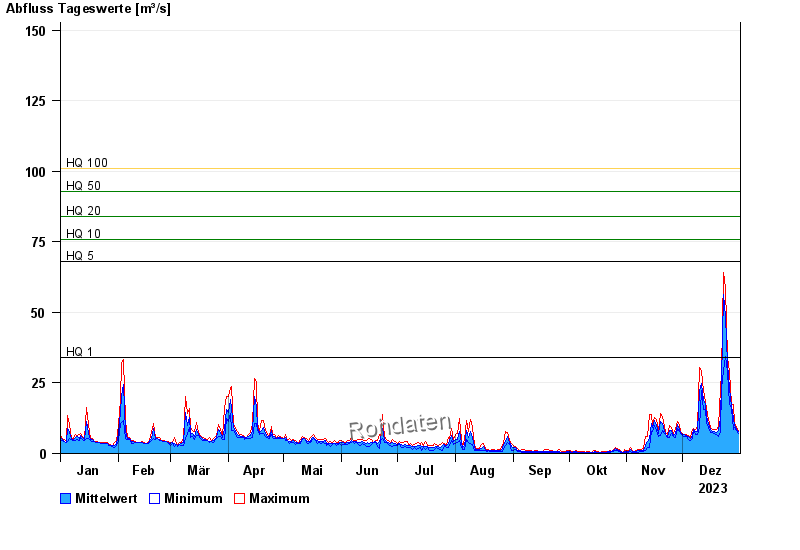
- Kothmaißling >
- Chart of year

Chart of year Kothmaißling / Chamb
Discharge from 01.01.2023 to 31.12.2023
note
Beeinflussung durch Buhneneinbau unterhalb vom Pegel
- HQ1 34 m³/s
- HQ5 68 m³/s
- HQ10 76 m³/s
- HQ20 84 m³/s
- HQ50 93 m³/s
- HQ100 101 m³/s
| Date | Mean value [m³/s] | Maximum [m³/s] | Minimum [m³/s] |
|---|---|---|---|
| 31.12.2023 | 7.66 | 8.05 | 7.01 |
| 30.12.2023 | 8.54 | 9.32 | 8.05 |
| 29.12.2023 | 9.97 | 10.6 | 9.32 |
| 28.12.2023 | 12.5 | 17.2 | 8.47 |
| 27.12.2023 | 16.6 | 17.2 | 15.9 |
| 26.12.2023 | 23.2 | 29 | 17.2 |
| 25.12.2023 | 32 | 34 | 29 |
© Bayerisches Landesamt für Umwelt 2024