
- Start >
- Rivers >
- Discharge >
- Bayern >
- Kauerndorf >
- Chart of year

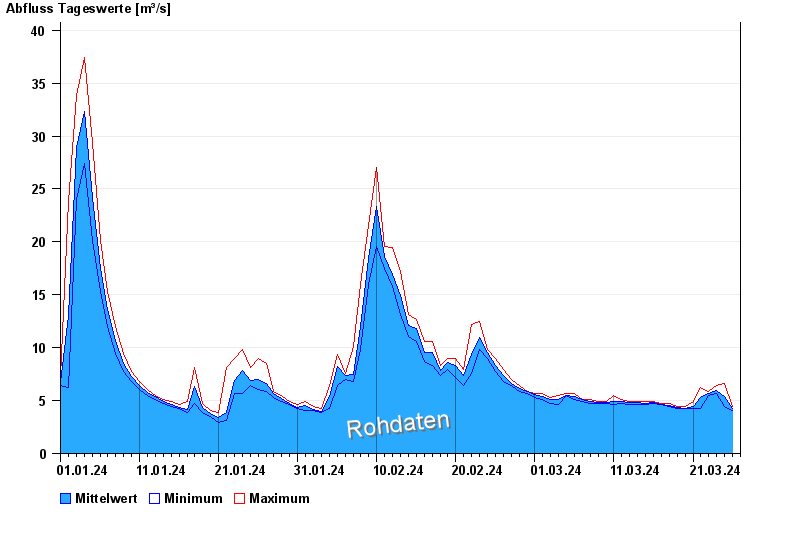
Chart of year Kauerndorf / Schorgast
Discharge from 01.01.2024 to 26.03.2024
note
Bauarbeiten am Pegel
| Date | Mean value [m³/s] | Maximum [m³/s] | Minimum [m³/s] |
|---|---|---|---|
| 26.03.2024 | 4.23 | 4.4 | 4.04 |
| 25.03.2024 | 5.43 | 6.65 | 4.4 |
| 24.03.2024 | 5.92 | 6.46 | 5.71 |
| 23.03.2024 | 5.69 | 5.89 | 5.52 |
| 22.03.2024 | 5.28 | 6.27 | 4.22 |
| 21.03.2024 | 4.42 | 4.96 | 4.22 |
| 20.03.2024 | 4.27 | 4.4 | 4.22 |
© Bayerisches Landesamt für Umwelt 2024