
- Start >
- Rivers >
- Discharge >
- Bayern >
- Kauerndorf >
- Chart of year

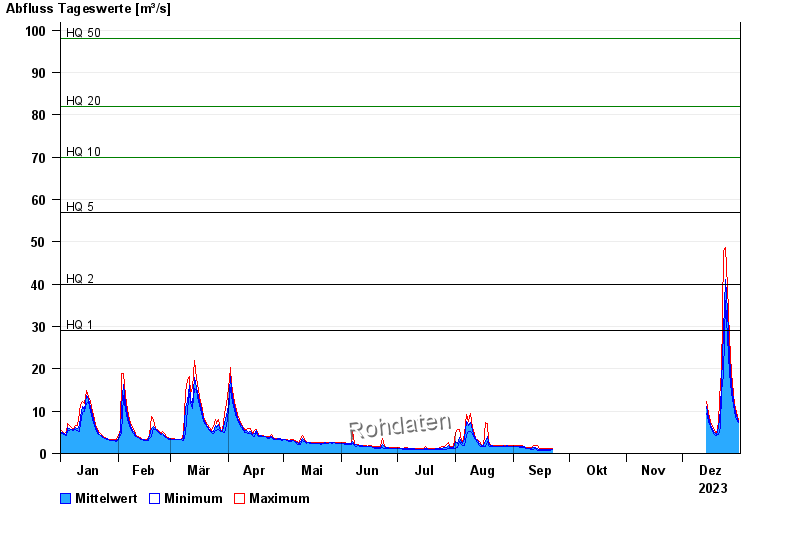
Chart of year Kauerndorf / Schorgast
Discharge from 01.01.2023 to 31.12.2023
note
Bauarbeiten am Pegel
- HQ1 29 m³/s
- HQ2 40 m³/s
- HQ5 57 m³/s
- HQ10 70 m³/s
- HQ20 82 m³/s
- HQ50 98 m³/s
- HQ100 110 m³/s
| Date | Mean value [m³/s] | Maximum [m³/s] | Minimum [m³/s] |
|---|---|---|---|
| 31.12.2023 | 7.56 | 7.98 | 7.22 |
| 30.12.2023 | 8.92 | 9.66 | 7.98 |
| 29.12.2023 | 10.6 | 11.5 | 9.66 |
| 28.12.2023 | 12.7 | 14.1 | 11.5 |
| 27.12.2023 | 16.2 | 19 | 14.2 |
| 26.12.2023 | 22.6 | 27.4 | 19 |
| 25.12.2023 | 33.9 | 39.4 | 27.4 |
© Bayerisches Landesamt für Umwelt 2024