
- Start >
- Rivers >
- Discharge >
- Bayern >
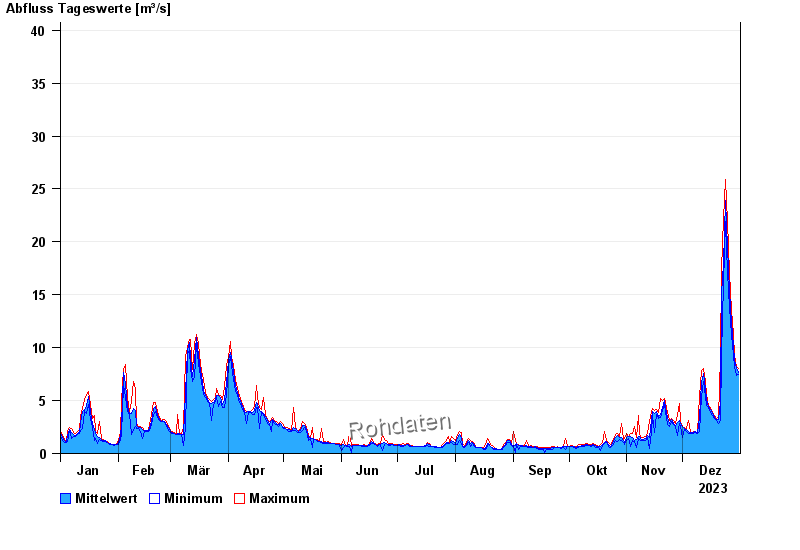
- Johannisthal >
- Chart of year

Chart of year Johannisthal / Tirschenreuther Waldnaab
Discharge from 01.01.2023 to 31.12.2023
- 06.01.1982 Abfluss: 64,1 m³/s
- 06.02.1980 Abfluss: 50,2 m³/s
- 03.01.2003 Abfluss: 49,6 m³/s
- 26.01.1995 Abfluss: 47,6 m³/s
- 02.11.1998 Abfluss: 47,1 m³/s
| Date | Mean value [m³/s] | Maximum [m³/s] | Minimum [m³/s] |
|---|---|---|---|
| 31.12.2023 | 7.66 | 8.07 | 7.51 |
| 30.12.2023 | 8.09 | 8.26 | 7.33 |
| 29.12.2023 | 8.78 | 9.23 | 8.26 |
| 28.12.2023 | 10.1 | 11.2 | 9.23 |
| 27.12.2023 | 12.4 | 13.5 | 11.2 |
| 26.12.2023 | 15.3 | 17.1 | 13.8 |
| 25.12.2023 | 19.5 | 21.9 | 17.1 |
© Bayerisches Landesamt für Umwelt 2024