
- Start >
- Rivers >
- Discharge >
- Bayern >
- Johannisthal >
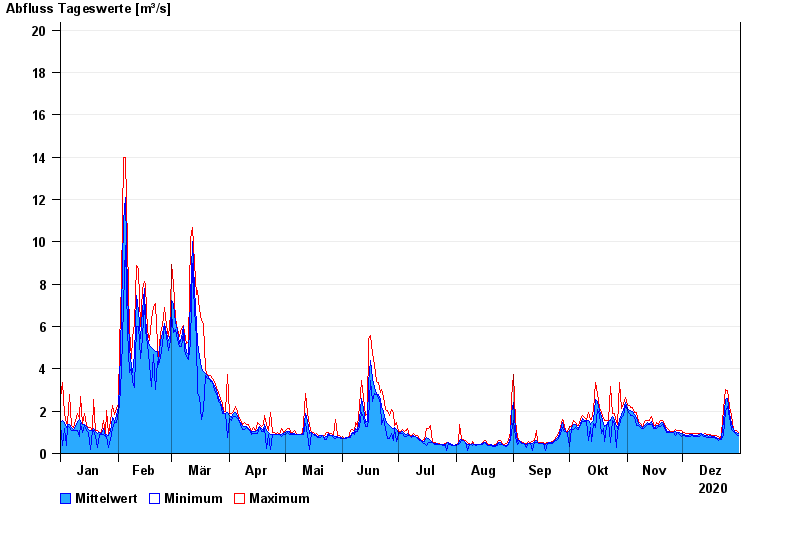
- Chart of year

Chart of year Johannisthal / Tirschenreuther Waldnaab
Discharge from 01.01.2020 to 31.12.2020
- 06.01.1982 Abfluss: 64,1 m³/s
- 06.02.1980 Abfluss: 50,2 m³/s
- 03.01.2003 Abfluss: 49,6 m³/s
- 26.01.1995 Abfluss: 47,6 m³/s
- 02.11.1998 Abfluss: 47,1 m³/s
| Date | Mean value [m³/s] | Maximum [m³/s] | Minimum [m³/s] |
|---|---|---|---|
| 31.12.2020 | 0.928 | 1.01 | 0.856 |
| 30.12.2020 | 1.01 | 1.08 | 0.919 |
| 29.12.2020 | 1.05 | 1.07 | 0.988 |
| 28.12.2020 | 1.12 | 1.15 | 1.06 |
| 27.12.2020 | 1.42 | 1.79 | 1.14 |
| 26.12.2020 | 1.89 | 2.22 | 1.68 |
| 25.12.2020 | 2.58 | 2.97 | 2.22 |
© Bayerisches Landesamt für Umwelt 2024