
- Start >
- Rivers >
- Discharge >
- Bayern >
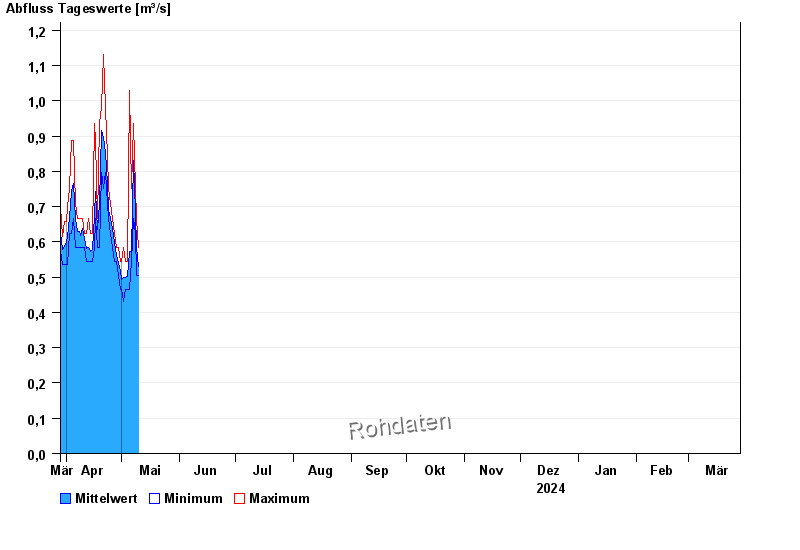
- Iglersreuth Speicherzufluss >
- Chart of year

Chart of year Iglersreuth Speicherzufluss / Tirschenreuther Waldnaab
Discharge from 29.03.2024 to 28.03.2025
- 10.08.1984 Abfluss: 80 m³/s
- 05.05.1984 Abfluss: 54,7 m³/s
- 14.06.2020 Abfluss: 16,5 m³/s
- 06.06.1984 Abfluss: 15,9 m³/s
- 12.02.2005 Abfluss: 14,1 m³/s
| Date | Mean value [m³/s] | Maximum [m³/s] | Minimum [m³/s] |
|---|---|---|---|
| 03.06.2024 | 0.935 | 0.955 | 0.908 |
| 02.06.2024 | 1.19 | 1.65 | 0.955 |
| 01.06.2024 | 1.37 | 1.9 | 0.862 |
| 31.05.2024 | 0.84 | 0.908 | 0.816 |
| 30.05.2024 | 0.933 | 0.955 | 0.908 |
| 29.05.2024 | 1.11 | 1.36 | 0.955 |
| 28.05.2024 | 3.98 | 8.18 | 1.36 |
© Bayerisches Landesamt für Umwelt 2024