
- Start >
- Rivers >
- Discharge >
- Bayern >
- Iglersreuth Speicherzufluss >
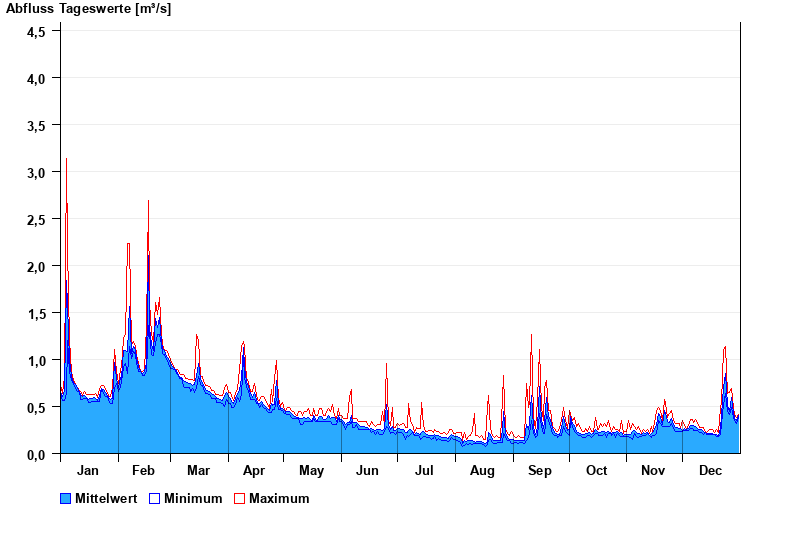
- Chart of year

Chart of year Iglersreuth Speicherzufluss / Tirschenreuther Waldnaab
Discharge from 01.01.2022 to 31.12.2022
- 10.08.1984 Abfluss: 80 m³/s
- 05.05.1984 Abfluss: 31 m³/s
- 06.06.1984 Abfluss: 19 m³/s
- 12.02.2005 Abfluss: 15,4 m³/s
- 26.01.1995 Abfluss: 13 m³/s
| Date | Mean value [m³/s] | Maximum [m³/s] | Minimum [m³/s] |
|---|---|---|---|
| 31.12.2022 | 0.406 | 0.417 | 0.382 |
| 30.12.2022 | 0.353 | 0.382 | 0.318 |
| 29.12.2022 | 0.372 | 0.415 | 0.348 |
| 28.12.2022 | 0.434 | 0.486 | 0.38 |
| 27.12.2022 | 0.591 | 0.686 | 0.486 |
| 26.12.2022 | 0.448 | 0.644 | 0.412 |
| 25.12.2022 | 0.511 | 0.641 | 0.447 |
© Bayerisches Landesamt für Umwelt 2024