
- Start >
- Rivers >
- Discharge >
- Bayern >
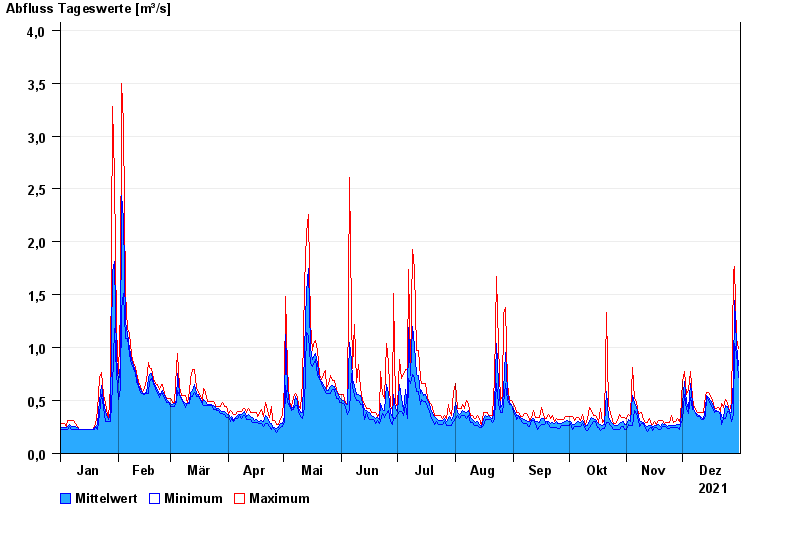
- Iglersreuth Speicherzufluss >
- Chart of year

Chart of year Iglersreuth Speicherzufluss / Tirschenreuther Waldnaab
Discharge from 01.01.2021 to 31.12.2021
| Date | Mean value [m³/s] | Maximum [m³/s] | Minimum [m³/s] |
|---|---|---|---|
| 31.12.2021 | 0.836 | 0.994 | 0.721 |
| 30.12.2021 | 1.03 | 1.09 | 0.945 |
| 29.12.2021 | 1.45 | 1.77 | 1.04 |
| 28.12.2021 | 0.691 | 1.71 | 0.369 |
| 27.12.2021 | 0.39 | 0.475 | 0.306 |
| 26.12.2021 | 0.401 | 0.402 | 0.4 |
| 25.12.2021 | 0.442 | 0.473 | 0.4 |
© Bayerisches Landesamt für Umwelt 2024