

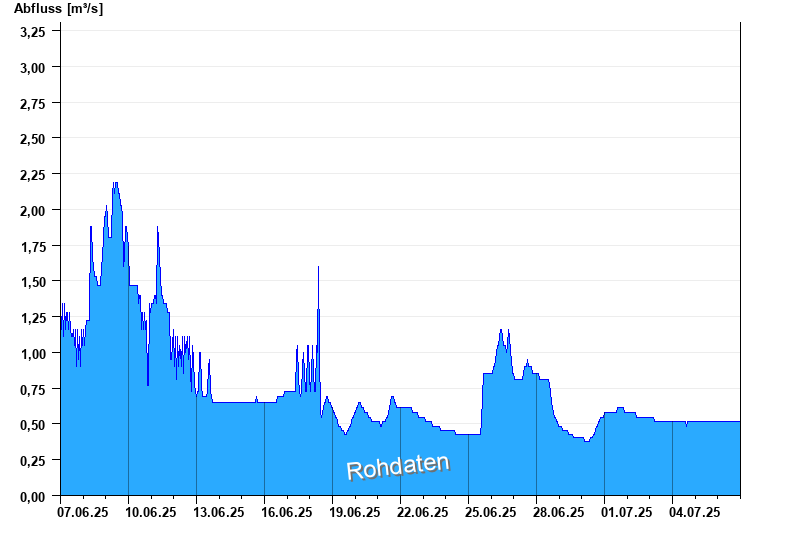
Chart of month Hohenberg / Eger
Discharge from 07.06.2025 to 06.07.2025
- 28.05.2006 Abfluss: 63 m³/s
- 14.01.2011 Abfluss: 57,1 m³/s
- 13.02.2005 Abfluss: 55,1 m³/s
- 01.11.1998 Abfluss: 52,9 m³/s
- 06.01.1982 Abfluss: 49,9 m³/s
| Date | Runoff [m³/s] |
|---|---|
| 07.07.2025 00:45 | 0.515 |
| 07.07.2025 00:30 | 0.515 |
| 07.07.2025 00:15 | 0.515 |
| 07.07.2025 00:00 | 0.515 |
| 06.07.2025 23:45 | 0.515 |
| 06.07.2025 23:30 | 0.515 |
| 06.07.2025 23:15 | 0.515 |
© Bayerisches Landesamt für Umwelt 2025