
- Start >
- Rivers >
- Discharge >
- Bayern >
- Hörmanshofen >
- Chart of year

Chart of year Hörmanshofen / Geltnach
Discharge from 01.01.2023 to 31.12.2023
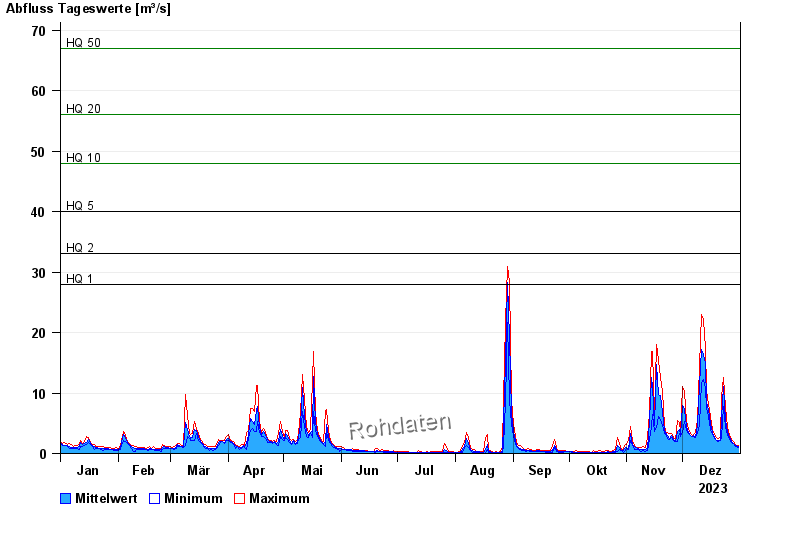
- HQ1 28 m³/s
- HQ2 33 m³/s
- HQ5 40 m³/s
- HQ10 48 m³/s
- HQ20 56 m³/s
- HQ50 67 m³/s
- HQ100 75 m³/s
| Date | Mean value [m³/s] | Maximum [m³/s] | Minimum [m³/s] |
|---|---|---|---|
| 31.12.2023 | 1.15 | 1.27 | 1.03 |
| 30.12.2023 | 1.3 | 1.39 | 1.15 |
| 29.12.2023 | 1.5 | 1.65 | 1.27 |
| 28.12.2023 | 1.7 | 1.93 | 1.65 |
| 27.12.2023 | 2.06 | 2.24 | 1.79 |
| 26.12.2023 | 2.67 | 3.1 | 2.24 |
| 25.12.2023 | 3.68 | 4.25 | 3.1 |
© Bayerisches Landesamt für Umwelt 2025