
- Start >
- Rivers >
- Discharge >
- Bayern >
- Hörmannsberg >
- Chart of year

Chart of year Hörmannsberg / Gaißa
Discharge from 30.03.2024 to 29.03.2025
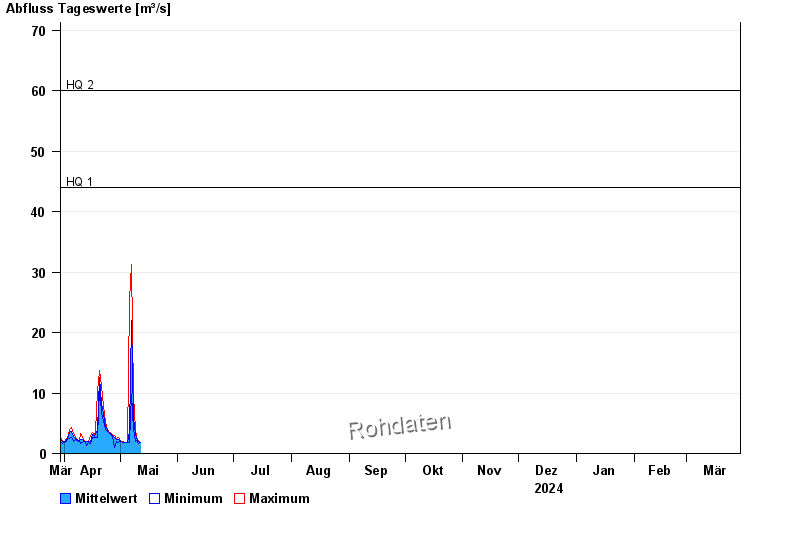
- HQ1 44 m³/s
- HQ2 60 m³/s
- HQ5 75 m³/s
- HQ10 90 m³/s
- HQ20 120 m³/s
- HQ50 135 m³/s
- HQ100 160 m³/s
| Date | Mean value [m³/s] | Maximum [m³/s] | Minimum [m³/s] |
|---|---|---|---|
| 28.04.2024 | 2.88 | 2.97 | 2.72 |
| 27.04.2024 | 3.03 | 3.22 | 2.84 |
| 26.04.2024 | 3.35 | 3.48 | 3.09 |
| 25.04.2024 | 3.49 | 3.62 | 3.48 |
| 24.04.2024 | 3.86 | 4.03 | 3.62 |
| 23.04.2024 | 4.51 | 5.08 | 4.03 |
| 22.04.2024 | 6.66 | 8 | 5.24 |
© Bayerisches Landesamt für Umwelt 2024