

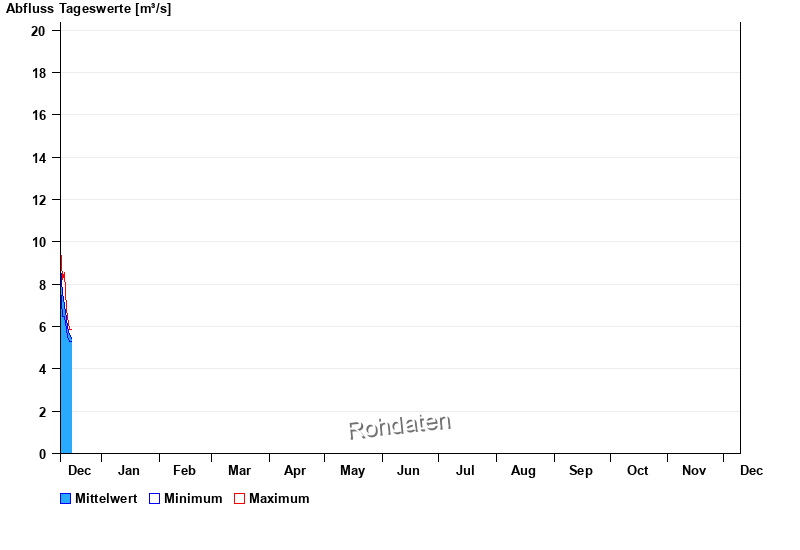
Chart of year Hochberg / Traun
Discharge from 10.12.2025 to 09.12.2026
- HQ1 135 m³/s
- HQ2 170 m³/s
- HQ5 229 m³/s
- HQ10 267 m³/s
- HQ20 311 m³/s
- HQ50 360 m³/s
- HQ100 420 m³/s
| Date | Mean value [m³/s] | Maximum [m³/s] | Minimum [m³/s] |
|---|---|---|---|
| 16.12.2025 | 5.64 | 5.85 | 5.55 |
| 15.12.2025 | 5.63 | 5.85 | 5.27 |
| 14.12.2025 | 5.93 | 6.48 | 5.55 |
| 13.12.2025 | 6.39 | 6.81 | 5.85 |
| 12.12.2025 | 6.97 | 8.56 | 6.48 |
| 11.12.2025 | 7.58 | 8.21 | 6.48 |
| 10.12.2025 | 8.82 | 9.74 | 7.82 |
© Bayerisches Landesamt für Umwelt 2025