

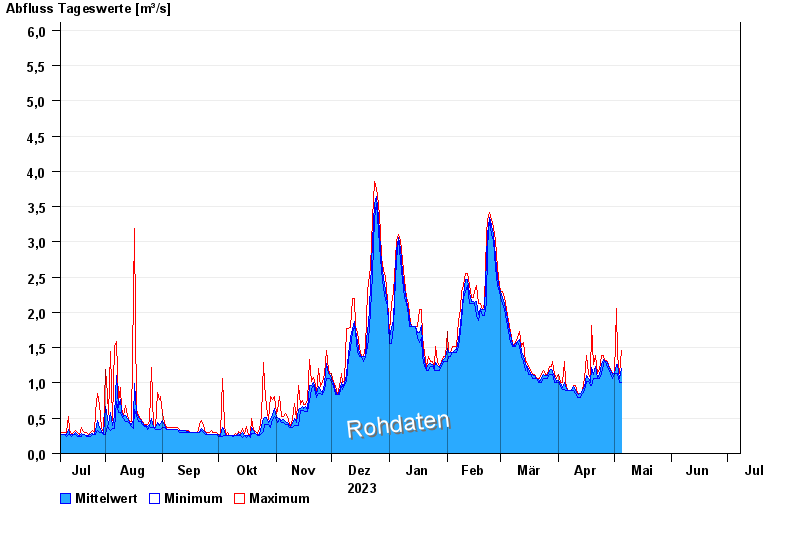
Chart of year Hobbach / Elsava
Discharge from 08.07.2023 to 07.07.2024
- 14.01.2011 Abfluss: 13,5 m³/s
- 27.01.1995 Abfluss: 11,1 m³/s
- 01.06.2013 Abfluss: 7,61 m³/s
- 04.03.2008 Abfluss: 7,51 m³/s
- 15.04.1994 Abfluss: 7,42 m³/s
| Date | Mean value [m³/s] | Maximum [m³/s] | Minimum [m³/s] |
|---|---|---|---|
| 24.05.2024 | 1.23 | 1.6 | 0.743 |
| 23.05.2024 | 0.771 | 0.788 | 0.743 |
| 22.05.2024 | 0.845 | 0.899 | 0.788 |
| 21.05.2024 | 0.867 | 0.953 | 0.846 |
| 20.05.2024 | 0.848 | 0.899 | 0.846 |
| 19.05.2024 | 0.9 | 0.953 | 0.846 |
| 18.05.2024 | 0.935 | 1.01 | 0.899 |
© Bayerisches Landesamt für Umwelt 2024