

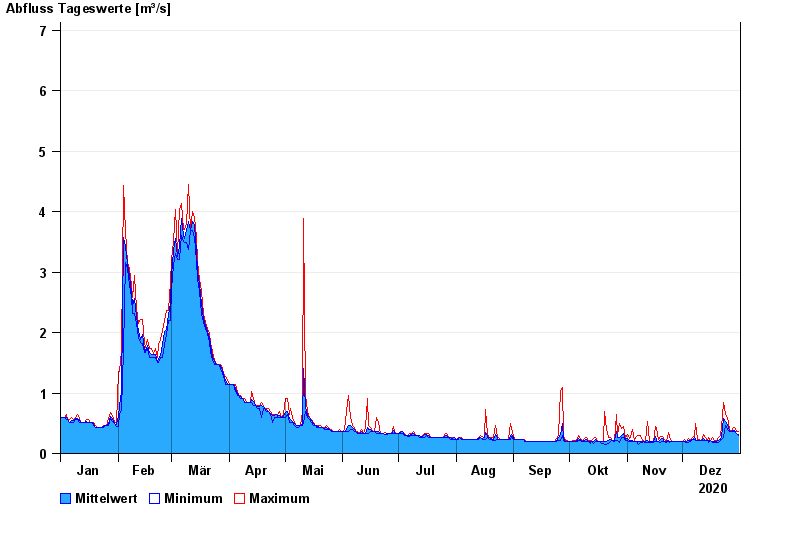
Chart of year Hobbach / Elsava
Discharge from 01.01.2020 to 31.12.2020
- 14.01.2011 Abfluss: 13,5 m³/s
- 27.01.1995 Abfluss: 11,1 m³/s
- 01.06.2013 Abfluss: 7,61 m³/s
- 04.03.2008 Abfluss: 7,51 m³/s
- 15.04.1994 Abfluss: 7,42 m³/s
| Date | Mean value [m³/s] | Maximum [m³/s] | Minimum [m³/s] |
|---|---|---|---|
| 31.12.2020 | 0.316 | 0.359 | 0.295 |
| 30.12.2020 | 0.337 | 0.358 | 0.325 |
| 29.12.2020 | 0.38 | 0.429 | 0.357 |
| 28.12.2020 | 0.374 | 0.428 | 0.357 |
| 27.12.2020 | 0.357 | 0.357 | 0.356 |
| 26.12.2020 | 0.383 | 0.391 | 0.356 |
| 25.12.2020 | 0.477 | 0.593 | 0.39 |
© Bayerisches Landesamt für Umwelt 2024