
- Start >
- Rivers >
- Discharge >
- Bayern >
- Heroldingen >
- Chart of year

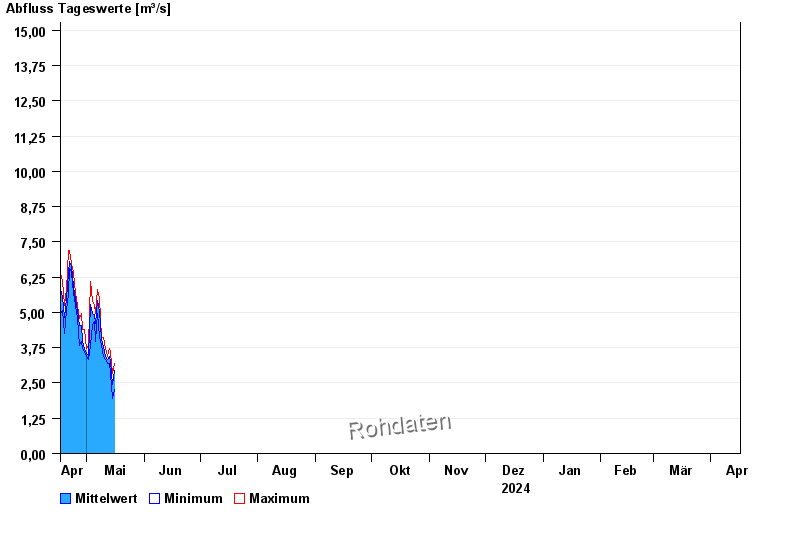
Chart of year Heroldingen / Wörnitz
Discharge from 17.04.2024 to 16.04.2025
- HQ1 80 m³/s
- HQ2 125 m³/s
- HQ5 180 m³/s
- HQ10 225 m³/s
- HQ20 275 m³/s
- HQ50 345 m³/s
- HQ100 410 m³/s
| Date | Mean value [m³/s] | Maximum [m³/s] | Minimum [m³/s] |
|---|---|---|---|
| 29.04.2024 | 3.93 | 4.11 | 3.71 |
| 28.04.2024 | 4.54 | 4.95 | 3.98 |
| 27.04.2024 | 4.54 | 4.8 | 3.84 |
| 26.04.2024 | 5.05 | 5.23 | 4.8 |
| 25.04.2024 | 5.44 | 5.66 | 5.23 |
| 24.04.2024 | 5.93 | 6.41 | 5.66 |
| 23.04.2024 | 6.64 | 6.72 | 6.41 |
© Bayerisches Landesamt für Umwelt 2024