
- Start >
- Rivers >
- Discharge >
- Bayern >
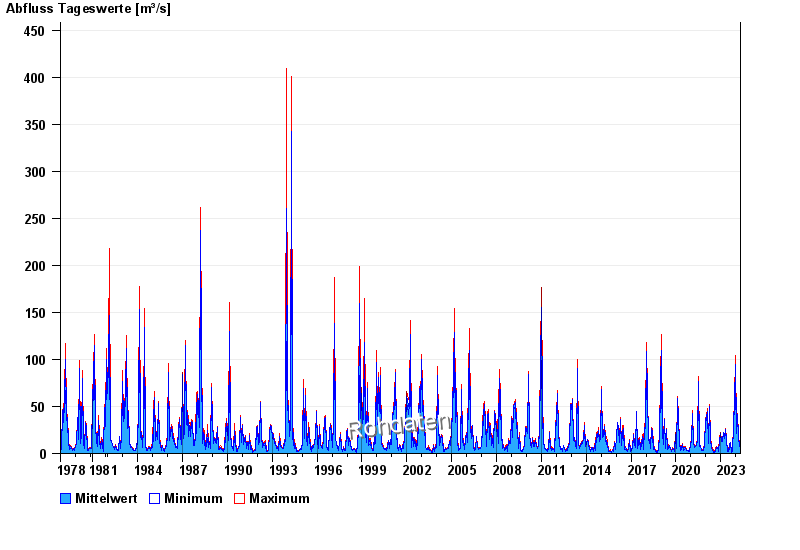
- Heroldingen >
- Chart of total period

Chart of total period Heroldingen / Wörnitz
Discharge from 01.11.1978 to 26.04.2024
| Date | Mean value [m³/s] | Maximum [m³/s] | Minimum [m³/s] |
|---|---|---|---|
| 26.04.2024 | 5.23 | 5.23 | 5.23 |
| 25.04.2024 | 5.44 | 5.66 | 5.23 |
| 24.04.2024 | 5.93 | 6.41 | 5.66 |
| 23.04.2024 | 6.64 | 6.72 | 6.41 |
| 22.04.2024 | 6.81 | 7.18 | 6.56 |
| 21.04.2024 | 6.4 | 7.18 | 5.66 |
| 20.04.2024 | 5.49 | 5.81 | 5.08 |
© Bayerisches Landesamt für Umwelt 2024