
- Start >
- Rivers >
- Discharge >
- Bayern >
- Heinersdorf >
- Chart of year

Chart of year Heinersdorf / Rodach
Discharge from 25.05.2021 to 24.05.2022
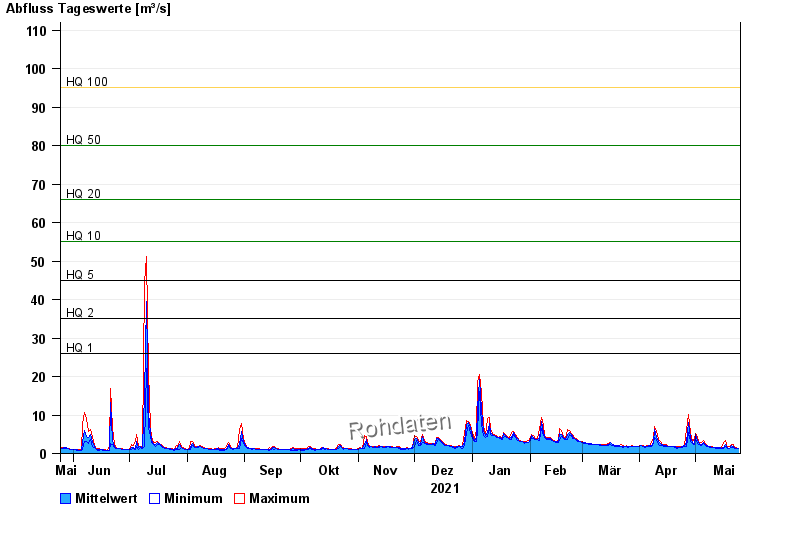
- HQ1 26 m³/s
- HQ2 35 m³/s
- HQ5 45 m³/s
- HQ10 55 m³/s
- HQ20 66 m³/s
- HQ50 80 m³/s
- HQ100 95 m³/s
| Date | Mean value [m³/s] | Maximum [m³/s] | Minimum [m³/s] |
|---|---|---|---|
| 24.05.2022 | 1.33 | 1.39 | 1.21 |
| 23.05.2022 | 1.38 | 1.44 | 1.3 |
| 22.05.2022 | 1.45 | 1.49 | 1.39 |
| 21.05.2022 | 1.73 | 2.28 | 1.44 |
| 20.05.2022 | 1.96 | 2.28 | 1.59 |
| 19.05.2022 | 1.4 | 1.7 | 1.35 |
| 18.05.2022 | 1.48 | 1.64 | 1.26 |
© Bayerisches Landesamt für Umwelt 2024