
- Start >
- Rivers >
- Discharge >
- Bayern >
- Heinersdorf >
- Chart of year

Chart of year Heinersdorf / Rodach
Discharge from 01.07.2023 to 30.06.2024
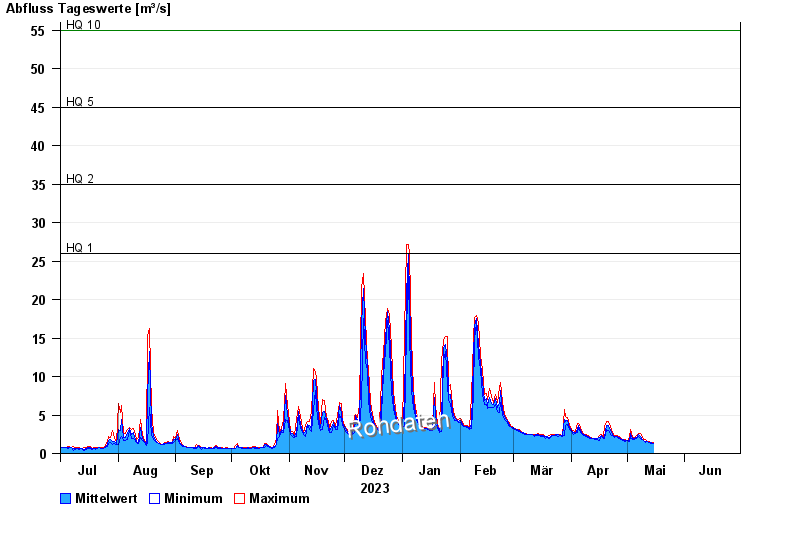
- HQ1 26 m³/s
- HQ2 35 m³/s
- HQ5 45 m³/s
- HQ10 55 m³/s
- HQ20 66 m³/s
- HQ50 80 m³/s
- HQ100 95 m³/s
| Date | Mean value [m³/s] | Maximum [m³/s] | Minimum [m³/s] |
|---|---|---|---|
| 15.05.2024 | 1.36 | 1.4 | 1.36 |
| 14.05.2024 | 1.4 | 1.45 | 1.36 |
| 13.05.2024 | 1.46 | 1.5 | 1.45 |
| 12.05.2024 | 1.52 | 1.6 | 1.5 |
| 11.05.2024 | 1.6 | 1.82 | 1.4 |
| 10.05.2024 | 1.73 | 1.82 | 1.65 |
| 09.05.2024 | 1.87 | 2.11 | 1.76 |
© Bayerisches Landesamt für Umwelt 2024