
- Start >
- Rivers >
- Discharge >
- Bayern >
- Heinersdorf >
- Chart of year

Chart of year Heinersdorf / Rodach
Discharge from 04.07.2021 to 03.07.2022
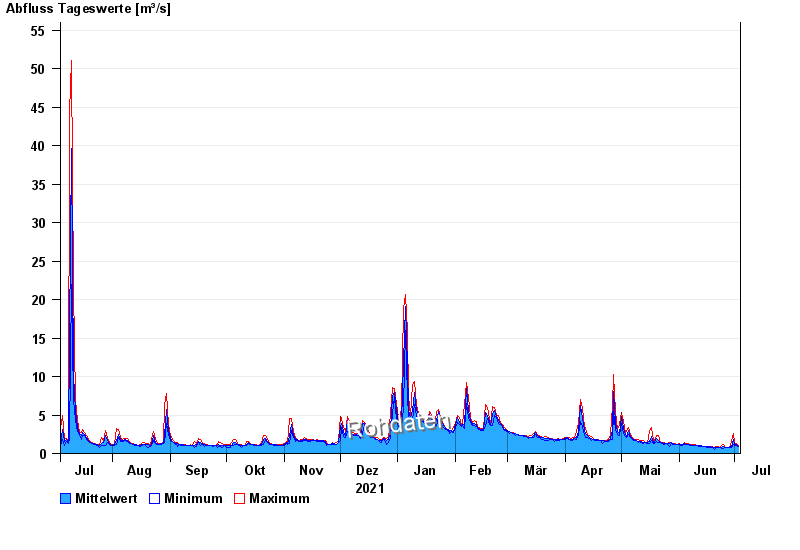
| Date | Mean value [m³/s] | Maximum [m³/s] | Minimum [m³/s] |
|---|---|---|---|
| 03.07.2022 | 0.943 | 0.996 | 0.878 |
| 02.07.2022 | 1.18 | 1.35 | 0.996 |
| 01.07.2022 | 1.16 | 1.3 | 0.996 |
| 30.06.2022 | 1.77 | 2.66 | 1.17 |
| 29.06.2022 | 0.869 | 1.59 | 0.726 |
| 28.06.2022 | 0.761 | 0.763 | 0.726 |
| 27.06.2022 | 0.743 | 0.763 | 0.726 |
© Bayerisches Landesamt für Umwelt 2024