
- Start >
- Rivers >
- Discharge >
- Bayern >
- Heinersdorf >
- Chart of year

Chart of year Heinersdorf / Rodach
Discharge from 29.06.2023 to 28.06.2024
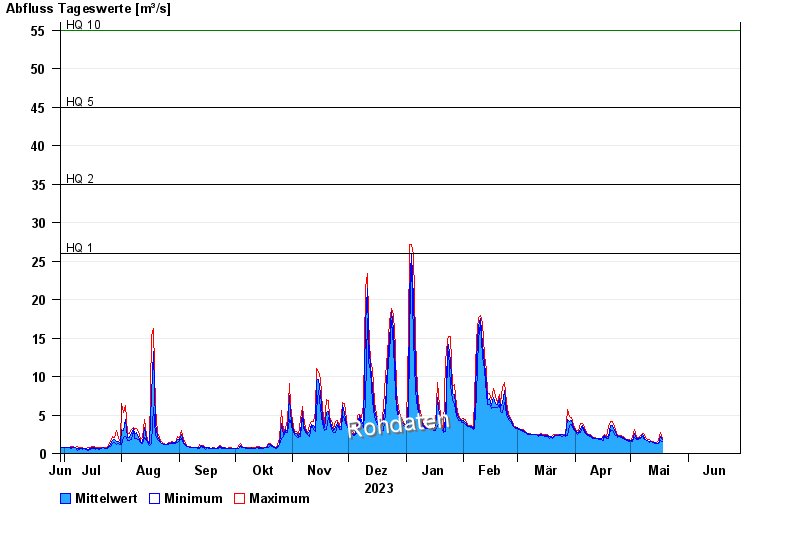
- HQ1 26 m³/s
- HQ2 35 m³/s
- HQ5 45 m³/s
- HQ10 55 m³/s
- HQ20 66 m³/s
- HQ50 80 m³/s
- HQ100 95 m³/s
| Date | Mean value [m³/s] | Maximum [m³/s] | Minimum [m³/s] |
|---|---|---|---|
| 05.05.2024 | 1.87 | 1.93 | 1.82 |
| 04.05.2024 | 1.93 | 2.11 | 1.76 |
| 03.05.2024 | 2.59 | 3.13 | 2.11 |
| 02.05.2024 | 1.65 | 2.05 | 1.6 |
| 01.05.2024 | 1.67 | 1.71 | 1.65 |
| 30.04.2024 | 1.7 | 1.76 | 1.6 |
| 29.04.2024 | 1.76 | 1.82 | 1.71 |
© Bayerisches Landesamt für Umwelt 2024