
- Start >
- Rivers >
- Discharge >
- Bayern >
- Heinersdorf >
- Chart of year

Chart of year Heinersdorf / Rodach
Discharge from 29.06.2021 to 28.06.2022
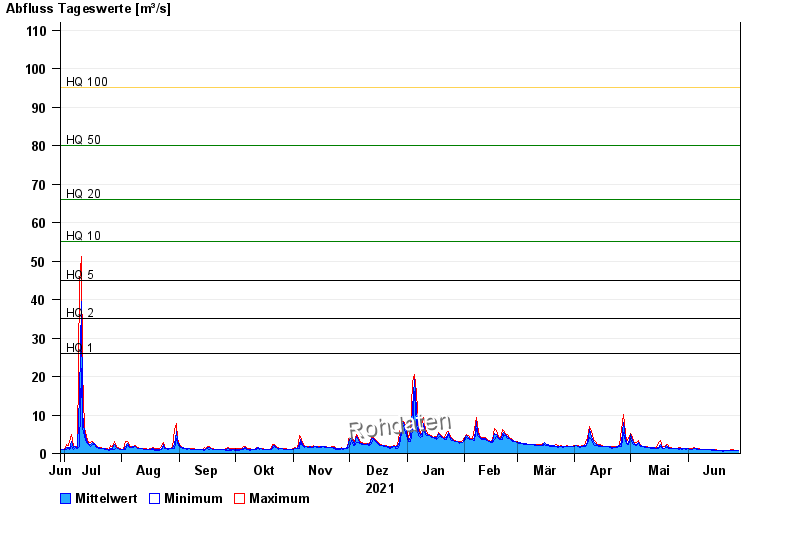
- HQ1 26 m³/s
- HQ2 35 m³/s
- HQ5 45 m³/s
- HQ10 55 m³/s
- HQ20 66 m³/s
- HQ50 80 m³/s
- HQ100 95 m³/s
| Date | Mean value [m³/s] | Maximum [m³/s] | Minimum [m³/s] |
|---|---|---|---|
| 28.06.2022 | 0.761 | 0.763 | 0.726 |
| 27.06.2022 | 0.743 | 0.763 | 0.726 |
| 26.06.2022 | 0.8 | 0.839 | 0.763 |
| 25.06.2022 | 0.881 | 1.12 | 0.655 |
| 24.06.2022 | 0.798 | 1.08 | 0.689 |
| 23.06.2022 | 0.799 | 0.839 | 0.726 |
| 22.06.2022 | 0.828 | 0.878 | 0.801 |
© Bayerisches Landesamt für Umwelt 2024