

Chart of total period Hasberg / Mindel
Discharge from 01.11.1964 to 29.04.2024
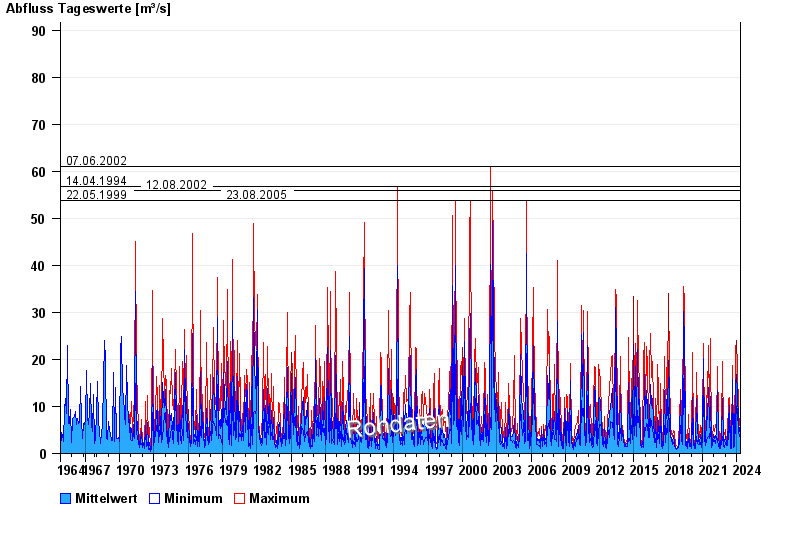
- 07.06.2002 Abfluss: 61 m³/s
- 14.04.1994 Abfluss: 56,8 m³/s
- 12.08.2002 Abfluss: 55,9 m³/s
- 22.05.1999 Abfluss: 53,8 m³/s
- 23.08.2005 Abfluss: 53,7 m³/s
| Date | Mean value [m³/s] | Maximum [m³/s] | Minimum [m³/s] |
|---|---|---|---|
| 29.04.2024 | 2.11 | 2.17 | 2.05 |
| 28.04.2024 | 2.21 | 2.29 | 2.05 |
| 27.04.2024 | 2.32 | 2.42 | 2.29 |
| 26.04.2024 | 2.44 | 2.54 | 2.29 |
| 25.04.2024 | 2.67 | 2.78 | 2.42 |
| 24.04.2024 | 3.04 | 3.21 | 2.78 |
| 23.04.2024 | 3.4 | 3.82 | 3.07 |
© Bayerisches Landesamt für Umwelt 2024