

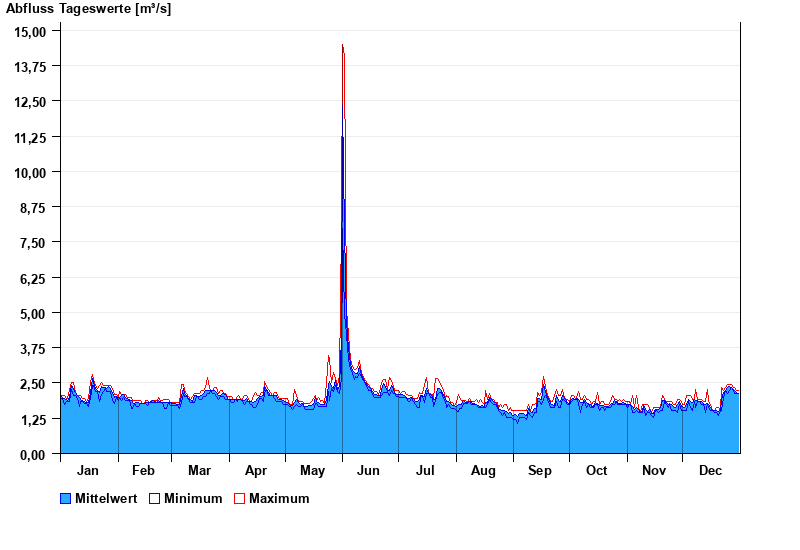
Chart of year Hasberg / Östliche Mindel
Discharge from 01.01.2024 to 31.12.2024
| Date | Mean value [m³/s] | Maximum [m³/s] | Minimum [m³/s] |
|---|---|---|---|
| 31.12.2024 | 2.13 | 2.22 | 2.11 |
| 30.12.2024 | 2.16 | 2.22 | 2.11 |
| 29.12.2024 | 2.23 | 2.33 | 2.11 |
| 28.12.2024 | 2.26 | 2.33 | 2.22 |
| 27.12.2024 | 2.34 | 2.45 | 2.33 |
| 26.12.2024 | 2.37 | 2.45 | 2.22 |
| 25.12.2024 | 2.34 | 2.45 | 2.11 |
© Bayerisches Landesamt für Umwelt 2025