
- Start >
- Rivers >
- Discharge >
- Bayern >
- Hallerndorf >
- Chart of year

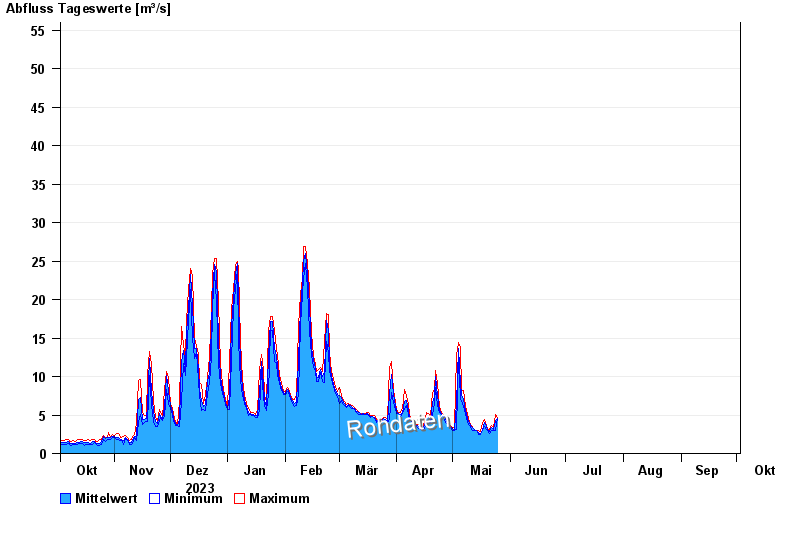
Chart of year Hallerndorf / Aisch
Discharge from 03.10.2023 to 02.10.2024
 Für diesen Pegel sind keine Jährlichkeiten hinterlegt.
| Date | Mean value [m³/s] | Maximum [m³/s] | Minimum [m³/s] |
|---|---|---|---|
| 05.05.2024 | 11 | 13.8 | 8.35 |
| 04.05.2024 | 13.7 | 14.4 | 12.7 |
| 03.05.2024 | 6.48 | 12.7 | 3.16 |
| 02.05.2024 | 3.1 | 3.41 | 3.05 |
| 01.05.2024 | 3.29 | 3.41 | 3.05 |
| 30.04.2024 | 3.48 | 3.66 | 3.41 |
| 29.04.2024 | 3.68 | 3.78 | 3.53 |
© Bayerisches Landesamt für Umwelt 2024