
- Start >
- Rivers >
- Discharge >
- Bayern >
- Hallerndorf >
- Chart of year

Chart of year Hallerndorf / Aisch
Discharge from 03.10.2021 to 02.10.2022
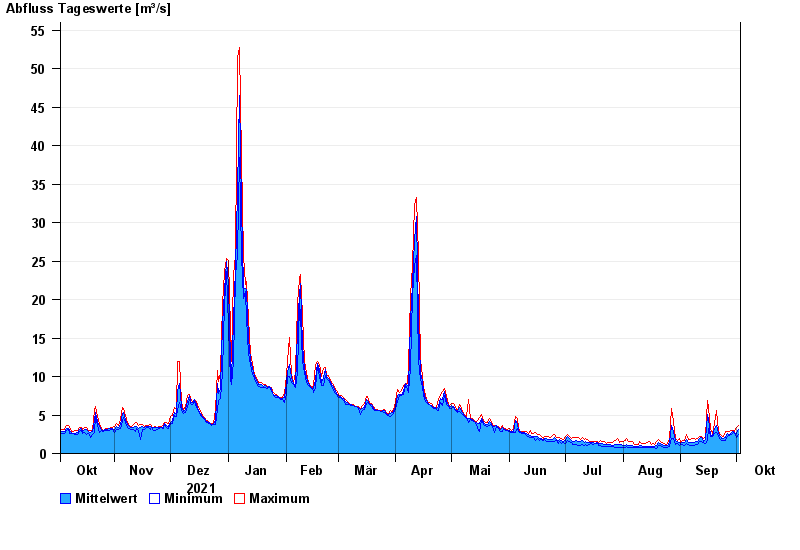
| Date | Mean value [m³/s] | Maximum [m³/s] | Minimum [m³/s] |
|---|---|---|---|
| 02.10.2022 | 3.13 | 3.66 | 2.51 |
| 01.10.2022 | 2.55 | 3.42 | 2.03 |
| 30.09.2022 | 2.69 | 2.83 | 2.61 |
| 29.09.2022 | 2.86 | 2.95 | 2.72 |
| 28.09.2022 | 2.7 | 2.95 | 2.41 |
| 27.09.2022 | 2.46 | 2.84 | 2.32 |
| 26.09.2022 | 2.56 | 2.84 | 2.22 |
© Bayerisches Landesamt für Umwelt 2024