
- Start >
- Rivers >
- Discharge >
- Bayern >
- Hallerndorf >
- Chart of year

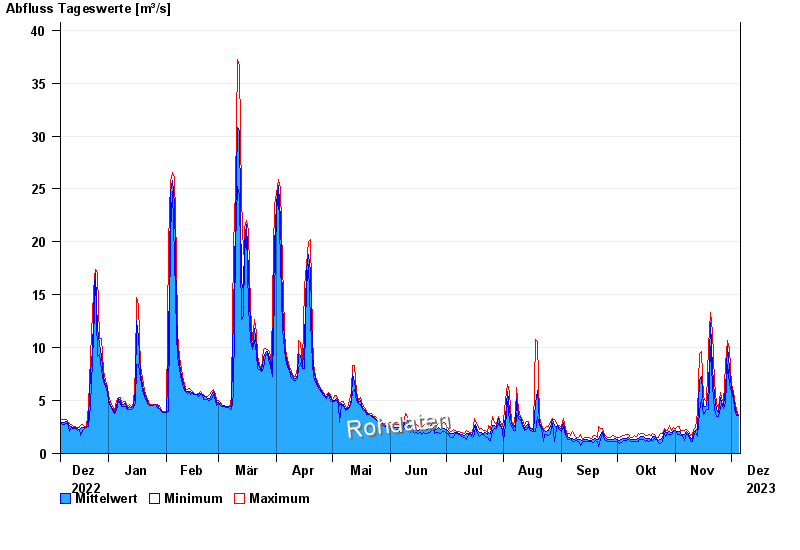
Chart of year Hallerndorf / Aisch
Discharge from 06.12.2022 to 05.12.2023
| Date | Mean value [m³/s] | Maximum [m³/s] | Minimum [m³/s] |
|---|---|---|---|
| 05.12.2023 | 3.59 | 3.59 | 3.59 |
| 04.12.2023 | 3.88 | 4.12 | 3.59 |
| 03.12.2023 | 4.56 | 5.13 | 4.12 |
| 02.12.2023 | 5.45 | 5.88 | 5.13 |
| 01.12.2023 | 6.22 | 6.52 | 5.88 |
| 30.11.2023 | 8.01 | 9.81 | 6.52 |
| 29.11.2023 | 10.1 | 10.7 | 8.37 |
© Bayerisches Landesamt für Umwelt 2024