
- Start >
- Rivers >
- Discharge >
- Bayern >
- Güntersthal >
- Chart of year

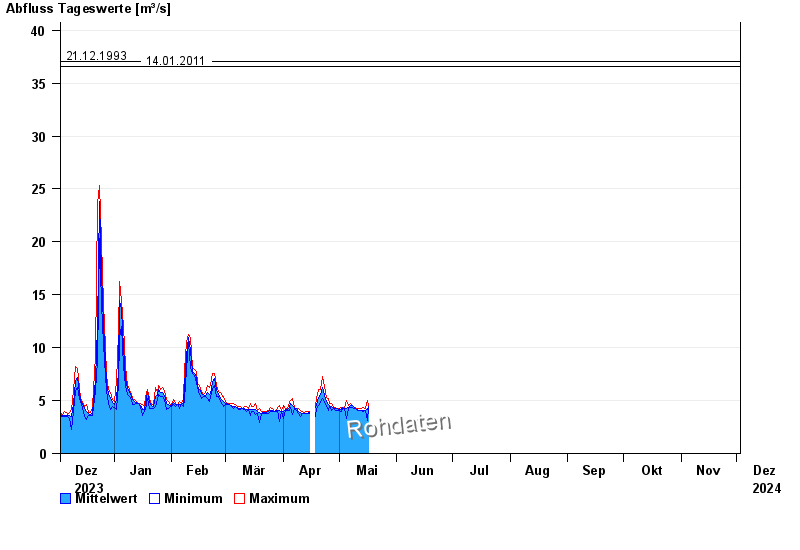
Chart of year Güntersthal / Pegnitz
Discharge from 03.12.2023 to 02.12.2024
- 23.02.1970 Abfluss: 50,9 m³/s
- 26.01.1995 Abfluss: 48,2 m³/s
- 03.01.2003 Abfluss: 40,6 m³/s
- 21.12.1993 Abfluss: 37 m³/s
- 14.01.2011 Abfluss: 36,6 m³/s
| Date | Mean value [m³/s] | Maximum [m³/s] | Minimum [m³/s] |
|---|---|---|---|
| 30.04.2024 | 4.23 | 4.23 | 4.23 |
| 29.04.2024 | 4.21 | 4.38 | 4.09 |
| 28.04.2024 | 4.31 | 4.38 | 4.23 |
| 27.04.2024 | 4.45 | 4.69 | 4.09 |
| 26.04.2024 | 4.56 | 4.69 | 4.54 |
| 25.04.2024 | 4.66 | 5.17 | 4.09 |
| 24.04.2024 | 4.88 | 5.33 | 4.54 |
© Bayerisches Landesamt für Umwelt 2024