
- Start >
- Rivers >
- Discharge >
- Bayern >
- Güntersthal >
- Chart of year

Chart of year Güntersthal / Pegnitz
Discharge from 01.01.2020 to 31.12.2020
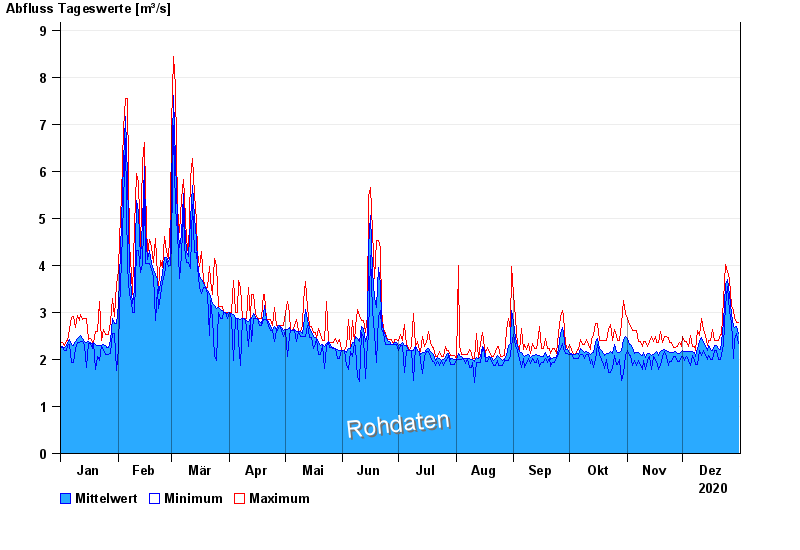
| Date | Mean value [m³/s] | Maximum [m³/s] | Minimum [m³/s] |
|---|---|---|---|
| 31.12.2020 | 2.56 | 2.78 | 2.33 |
| 30.12.2020 | 2.69 | 2.78 | 2.55 |
| 29.12.2020 | 2.67 | 2.9 | 2.43 |
| 28.12.2020 | 2.7 | 3.03 | 2.01 |
| 27.12.2020 | 2.96 | 3.15 | 2.78 |
| 26.12.2020 | 3.37 | 3.71 | 3.02 |
| 25.12.2020 | 3.7 | 3.86 | 3.56 |
© Bayerisches Landesamt für Umwelt 2024