
- Start >
- Rivers >
- Discharge >
- Bayern >
- Güntersthal >
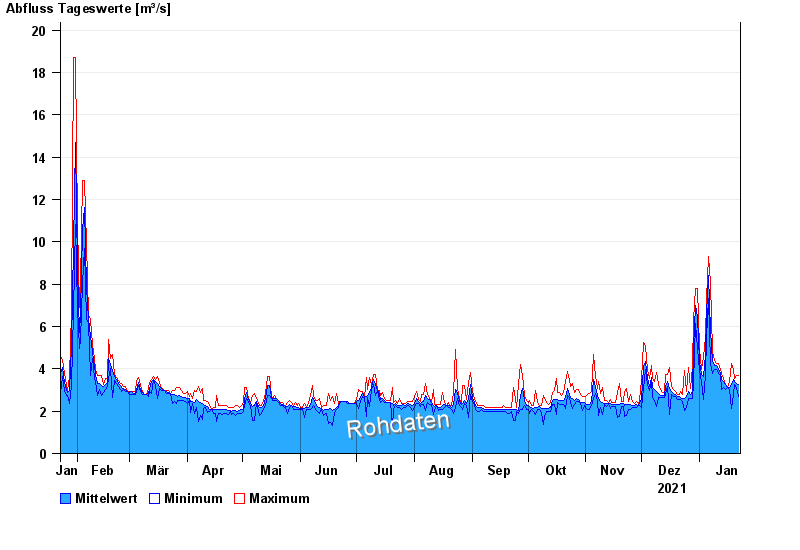
- Chart of year

Chart of year Güntersthal / Pegnitz
Discharge from 23.01.2021 to 22.01.2022
| Date | Mean value [m³/s] | Maximum [m³/s] | Minimum [m³/s] |
|---|---|---|---|
| 22.01.2022 | 3.24 | 3.67 | 2.67 |
| 21.01.2022 | 3.31 | 3.67 | 3.14 |
| 20.01.2022 | 3.41 | 3.53 | 3.27 |
| 19.01.2022 | 3.48 | 3.95 | 2.78 |
| 18.01.2022 | 3.24 | 4.23 | 2.14 |
| 17.01.2022 | 3.14 | 3.4 | 3.02 |
| 16.01.2022 | 3.14 | 3.14 | 3.14 |
© Bayerisches Landesamt für Umwelt 2024