
- Start >
- Rivers >
- Discharge >
- Bayern >
- Güntersthal >
- Chart of year

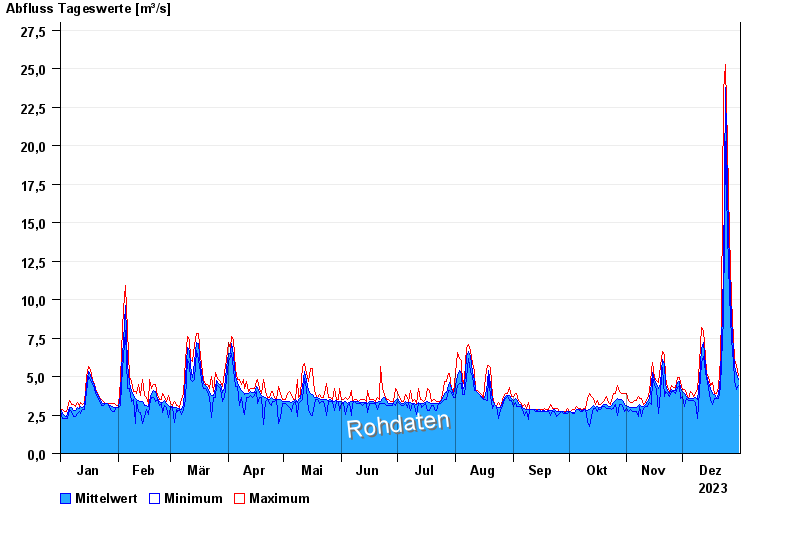
Chart of year Güntersthal / Pegnitz
Discharge from 01.01.2023 to 31.12.2023
| Date | Mean value [m³/s] | Maximum [m³/s] | Minimum [m³/s] |
|---|---|---|---|
| 31.12.2023 | 4.83 | 5.08 | 4.45 |
| 30.12.2023 | 5.18 | 5.74 | 4.15 |
| 29.12.2023 | 5.63 | 6.09 | 4.76 |
| 28.12.2023 | 6.6 | 7.41 | 5.91 |
| 27.12.2023 | 8.72 | 10.1 | 7.41 |
| 26.12.2023 | 12.1 | 14.2 | 10.3 |
| 25.12.2023 | 17.1 | 20 | 14.2 |
© Bayerisches Landesamt für Umwelt 2024