
- Start >
- Rivers >
- Discharge >
- Bayern >
- Güntersthal >
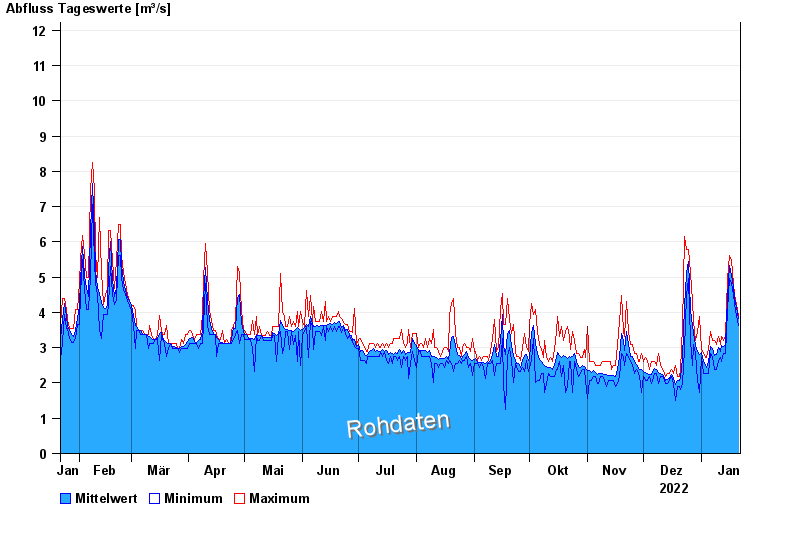
- Chart of year

Chart of year Güntersthal / Pegnitz
Discharge from 22.01.2022 to 21.01.2023
- 23.02.1970 Abfluss: 50,9 m³/s
- 26.01.1995 Abfluss: 48,2 m³/s
- 03.01.2003 Abfluss: 40,6 m³/s
- 21.12.1993 Abfluss: 37 m³/s
- 14.01.2011 Abfluss: 36,6 m³/s
| Date | Mean value [m³/s] | Maximum [m³/s] | Minimum [m³/s] |
|---|---|---|---|
| 21.01.2023 | 3.84 | 3.92 | 3.64 |
| 20.01.2023 | 4.13 | 4.21 | 3.92 |
| 19.01.2023 | 4.43 | 4.5 | 4.21 |
| 18.01.2023 | 4.74 | 4.82 | 4.5 |
| 17.01.2023 | 5.04 | 5.46 | 4.82 |
| 16.01.2023 | 5.34 | 5.62 | 4.97 |
| 15.01.2023 | 4.41 | 4.97 | 4.06 |
© Bayerisches Landesamt für Umwelt 2024