
- Start >
- Rivers >
- Discharge >
- Bayern >
- Großschwindau >
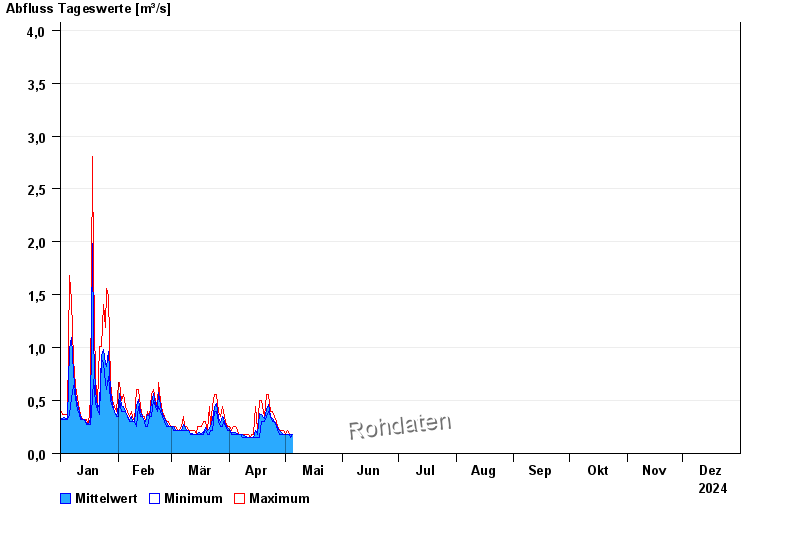
- Chart of year

Chart of year Großschwindau / Goldach
Discharge from 01.01.2024 to 31.12.2024
- 15.02.1990 Abfluss: 22,5 m³/s
- 03.08.1991 Abfluss: 22,1 m³/s
- 01.08.1991 Abfluss: 21,8 m³/s
- 09.06.1965 Abfluss: 20,1 m³/s
- 22.06.1965 Abfluss: 19,5 m³/s
| Date | Mean value [m³/s] | Maximum [m³/s] | Minimum [m³/s] |
|---|---|---|---|
| 06.06.2024 | 0.346 | 0.393 | 0.345 |
| 05.06.2024 | 0.457 | 0.553 | 0.393 |
| 04.06.2024 | 0.746 | 0.978 | 0.553 |
| 03.06.2024 | 1.18 | 1.49 | 0.345 |
| 02.06.2024 | 1.97 | 4.01 | 1.11 |
| 01.06.2024 | 7.52 | 14 | 1.49 |
| 31.05.2024 | 2.58 | 5.07 | 0.393 |
© Bayerisches Landesamt für Umwelt 2024