

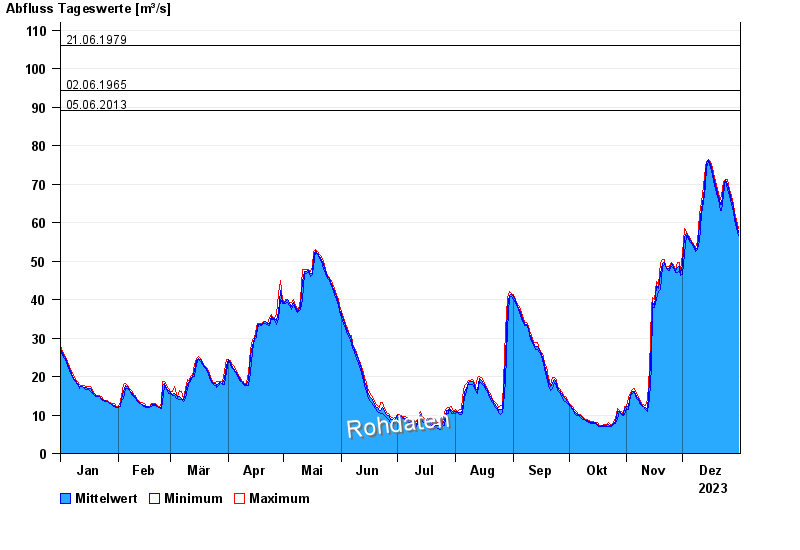
Chart of year Grafrath / Amper
Discharge from 01.01.2023 to 31.12.2023
- 24.05.1999 Abfluss: 167 m³/s
- 12.06.1965 Abfluss: 140 m³/s
- 21.06.1979 Abfluss: 106 m³/s
- 02.06.1965 Abfluss: 94,3 m³/s
- 05.06.2013 Abfluss: 89,2 m³/s
| Date | Mean value [m³/s] | Maximum [m³/s] | Minimum [m³/s] |
|---|---|---|---|
| 31.12.2023 | 50.1 | 51 | 49.3 |
| 30.12.2023 | 52.1 | 53.2 | 51 |
| 29.12.2023 | 54.2 | 55.2 | 53.2 |
| 28.12.2023 | 56.1 | 57 | 55.2 |
| 27.12.2023 | 58.1 | 59.1 | 57 |
| 26.12.2023 | 59.9 | 60.7 | 59.1 |
| 25.12.2023 | 61.8 | 63.1 | 60.7 |
© Bayerisches Landesamt für Umwelt 2025