
- Start >
- Rivers >
- Discharge >
- Bayern >
- Grafenmühle >
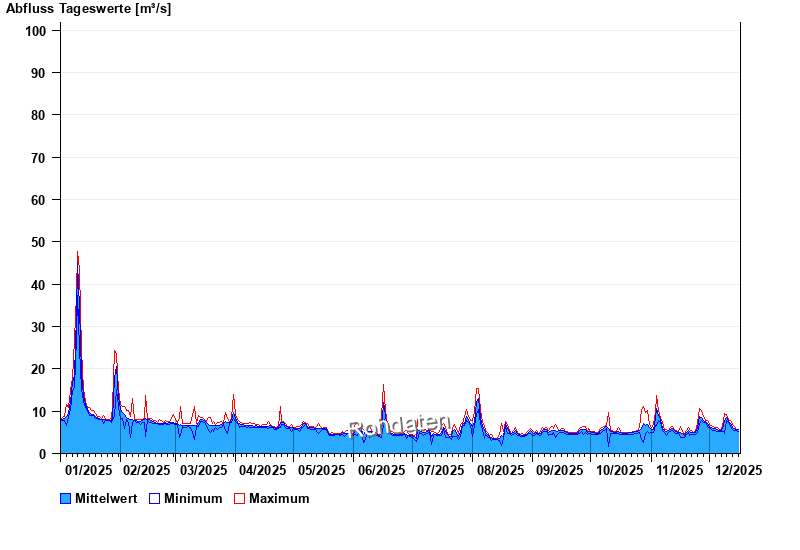
- Chart of year

Chart of year Grafenmühle / Vils
Discharge from 01.01.2025 to 16.12.2025
- HQ1 110 m³/s
- HQ2 148 m³/s
- HQ5 175 m³/s
- HQ10 205 m³/s
- HQ20 240 m³/s
| Date | Mean value [m³/s] | Maximum [m³/s] | Minimum [m³/s] |
|---|---|---|---|
| 16.12.2025 | 5.68 | 5.78 | 5.51 |
| 15.12.2025 | 5.58 | 5.78 | 5.51 |
| 14.12.2025 | 5.88 | 6.32 | 5.51 |
| 13.12.2025 | 6.21 | 6.92 | 5.78 |
| 12.12.2025 | 7.02 | 7.81 | 6.32 |
| 11.12.2025 | 7.6 | 8.14 | 7.22 |
| 10.12.2025 | 8.46 | 9.16 | 7.81 |
© Bayerisches Landesamt für Umwelt 2025