
- Start >
- Rivers >
- Discharge >
- Bayern >
- Grafenmühle >
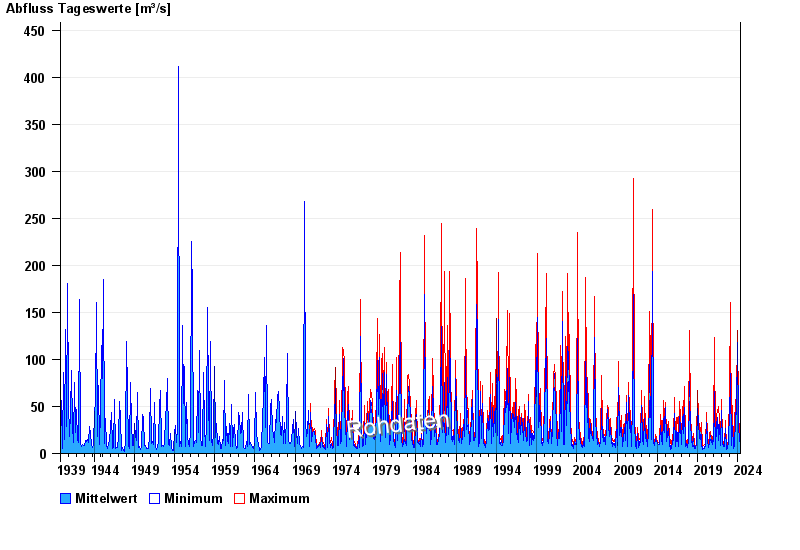
- Chart of total period

Chart of total period Grafenmühle / Vils
Discharge from 01.11.1939 to 30.04.2024
| Date | Mean value [m³/s] | Maximum [m³/s] | Minimum [m³/s] |
|---|---|---|---|
| 30.04.2024 | 6.29 | 6.48 | 6.21 |
| 29.04.2024 | 6.23 | 7.08 | 4.93 |
| 28.04.2024 | 6.46 | 6.77 | 5.94 |
| 27.04.2024 | 6.98 | 8.93 | 4.24 |
| 26.04.2024 | 7.44 | 7.66 | 7.08 |
| 25.04.2024 | 8.01 | 8.59 | 7.66 |
| 24.04.2024 | 8.63 | 8.93 | 8.32 |
© Bayerisches Landesamt für Umwelt 2024