

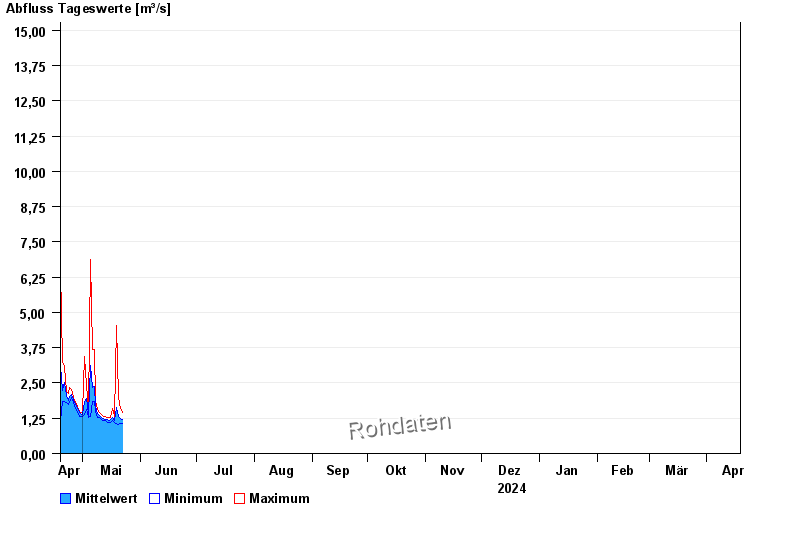
Chart of year Goldbach / Aschaff
Discharge from 19.04.2024 to 18.04.2025
- HQ1 16,5 m³/s
- HQ2 20 m³/s
- HQ5 29 m³/s
- HQ10 36 m³/s
- HQ20 45 m³/s
- HQ50 60 m³/s
- HQ100 72 m³/s
| Date | Mean value [m³/s] | Maximum [m³/s] | Minimum [m³/s] |
|---|---|---|---|
| 01.05.2024 | 1.38 | 1.44 | 1.32 |
| 30.04.2024 | 1.37 | 1.44 | 1.32 |
| 29.04.2024 | 1.44 | 1.49 | 1.32 |
| 28.04.2024 | 1.61 | 1.67 | 1.49 |
| 27.04.2024 | 1.73 | 1.8 | 1.61 |
| 26.04.2024 | 1.9 | 1.99 | 1.8 |
| 25.04.2024 | 2.08 | 2.26 | 1.99 |
© Bayerisches Landesamt für Umwelt 2024