
- Start >
- Rivers >
- Discharge >
- Bayern >
- Gogl-Mühle >
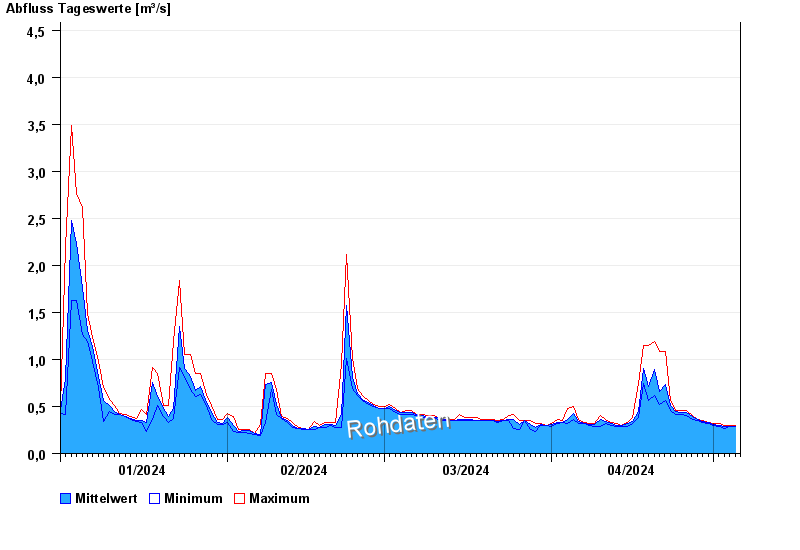
- Chart of year

Chart of year Gogl-Mühle / Chamb
Discharge from 01.01.2024 to 05.05.2024
- 01.06.2013 Abfluss: 54,6 m³/s
- 07.08.2010 Abfluss: 24,6 m³/s
- 22.07.1980 Abfluss: 19,2 m³/s
- 11.06.2013 Abfluss: 15,9 m³/s
- 12.08.2002 Abfluss: 12,9 m³/s
| Date | Mean value [m³/s] | Maximum [m³/s] | Minimum [m³/s] |
|---|---|---|---|
| 05.05.2024 | 0.282 | 0.282 | 0.282 |
| 04.05.2024 | 0.291 | 0.297 | 0.282 |
| 03.05.2024 | 0.29 | 0.297 | 0.266 |
| 02.05.2024 | 0.295 | 0.314 | 0.282 |
| 01.05.2024 | 0.309 | 0.314 | 0.297 |
| 30.04.2024 | 0.327 | 0.33 | 0.314 |
| 29.04.2024 | 0.344 | 0.347 | 0.33 |
© Bayerisches Landesamt für Umwelt 2024