
- Start >
- Rivers >
- Discharge >
- Bayern >
- Gerolfingen >
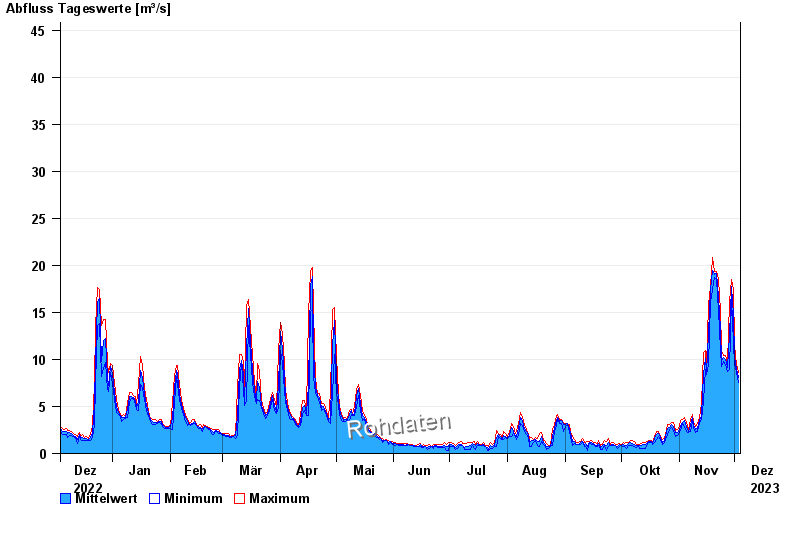
- Chart of year

Chart of year Gerolfingen / Wörnitz
Discharge from 04.12.2022 to 03.12.2023
- HQ1 69 m³/s
- HQ2 90 m³/s
- HQ5 120 m³/s
- HQ10 150 m³/s
- HQ20 175 m³/s
- HQ50 210 m³/s
- HQ100 235 m³/s
| Date | Mean value [m³/s] | Maximum [m³/s] | Minimum [m³/s] |
|---|---|---|---|
| 03.12.2023 | 8.1 | 8.59 | 7.54 |
| 02.12.2023 | 8.98 | 9.44 | 8.59 |
| 01.12.2023 | 10.3 | 11.5 | 9.44 |
| 30.11.2023 | 14.7 | 17.4 | 11.7 |
| 29.11.2023 | 17.8 | 18.5 | 16.5 |
| 28.11.2023 | 12.5 | 16.2 | 8.89 |
| 27.11.2023 | 9.16 | 9.62 | 8.72 |
© Bayerisches Landesamt für Umwelt 2024