
- Start >
- Rivers >
- Discharge >
- Bayern >
- Gerolfingen >
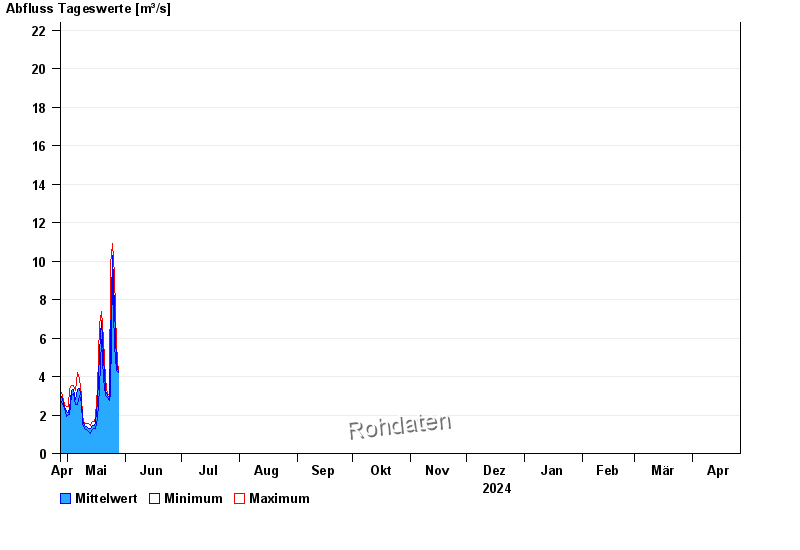
- Chart of year

Chart of year Gerolfingen / Wörnitz
Discharge from 27.04.2024 to 26.04.2025
- HQ1 69 m³/s
- HQ2 90 m³/s
- HQ5 120 m³/s
- HQ10 150 m³/s
- HQ20 175 m³/s
- HQ50 210 m³/s
- HQ100 235 m³/s
| Date | Mean value [m³/s] | Maximum [m³/s] | Minimum [m³/s] |
|---|---|---|---|
| 07.05.2024 | 3.82 | 4.05 | 3.65 |
| 06.05.2024 | 3.47 | 4.32 | 2.66 |
| 05.05.2024 | 2.98 | 3.52 | 2.66 |
| 04.05.2024 | 3.56 | 3.65 | 3.39 |
| 03.05.2024 | 3.49 | 3.78 | 3.26 |
| 02.05.2024 | 2.32 | 3.39 | 2.01 |
| 01.05.2024 | 2.12 | 2.44 | 2.01 |
© Bayerisches Landesamt für Umwelt 2024