
- Start >
- Rivers >
- Discharge >
- Bayern >
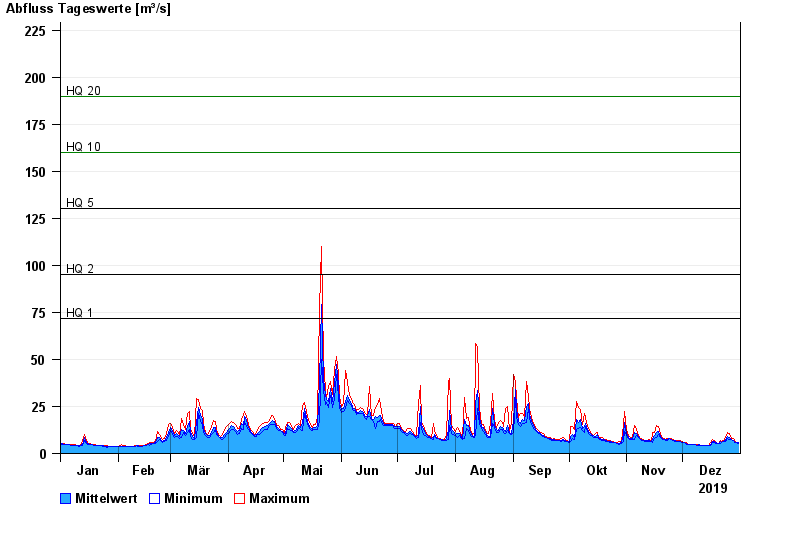
- Garmisch u. d. Partnachmündung >
- Chart of year

Chart of year Garmisch u. d. Partnachmündung / Loisach
Discharge from 01.01.2019 to 31.12.2019
note
Messwerte beeinflusst durch Kraftwerkssteuerungen.
- HQ1 72 m³/s
- HQ2 95 m³/s
- HQ5 130 m³/s
- HQ10 160 m³/s
- HQ20 190 m³/s
- HQ50 240 m³/s
- HQ100 270 m³/s
| Date | Mean value [m³/s] | Maximum [m³/s] | Minimum [m³/s] |
|---|---|---|---|
| 31.12.2019 | 5.63 | 5.76 | 5.34 |
| 30.12.2019 | 5.82 | 5.99 | 5.76 |
| 29.12.2019 | 6.22 | 6.7 | 5.99 |
| 28.12.2019 | 7.1 | 7.78 | 6.7 |
| 27.12.2019 | 7.4 | 7.78 | 7.22 |
| 26.12.2019 | 8.56 | 10.7 | 7.5 |
| 25.12.2019 | 9.21 | 11 | 7.78 |
© Bayerisches Landesamt für Umwelt 2024