
- Start >
- Rivers >
- Discharge >
- Bayern >
- Garmisch o. d. Partnachmündung >
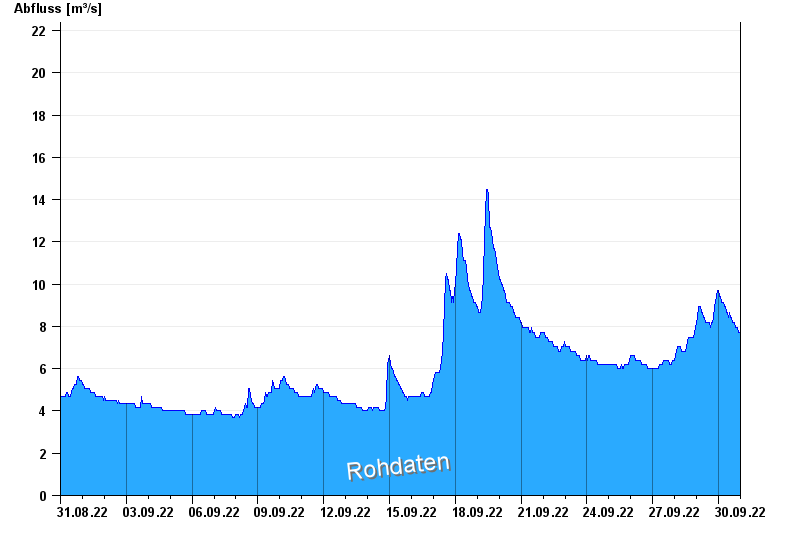
- Chart of month

Chart of month Garmisch o. d. Partnachmündung / Loisach
Discharge from 31.08.2022 to 30.09.2022
- 22.05.1999 Abfluss: 148 m³/s
- 23.08.2005 Abfluss: 141 m³/s
- 10.08.1970 Abfluss: 123 m³/s
- 11.06.1965 Abfluss: 120 m³/s
- 20.07.1981 Abfluss: 117 m³/s
| Date | Runoff [m³/s] |
|---|---|
| 01.10.2022 00:45 | 7.72 |
| 01.10.2022 00:30 | 7.72 |
| 01.10.2022 00:15 | 7.72 |
| 01.10.2022 00:00 | 7.72 |
| 30.09.2022 23:45 | 7.72 |
| 30.09.2022 23:30 | 7.72 |
| 30.09.2022 23:15 | 7.72 |
© Bayerisches Landesamt für Umwelt 2024