
- Start >
- Rivers >
- Discharge >
- Bayern >
- Gampelmühle >
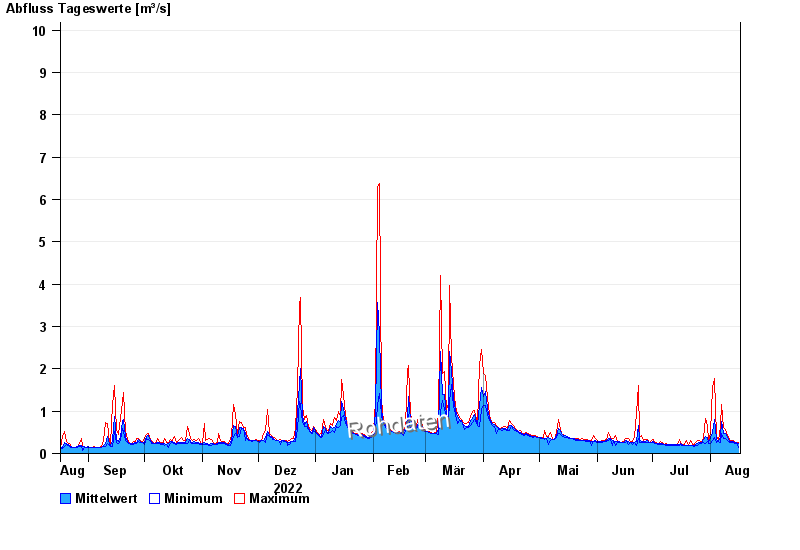
- Chart of year

Chart of year Gampelmühle / Ölschnitz
Discharge from 17.08.2022 to 16.08.2023
- 06.06.1984 Abfluss: 25,5 m³/s
- 16.08.1972 Abfluss: 20,4 m³/s
- 23.02.1970 Abfluss: 19,8 m³/s
- 26.01.1995 Abfluss: 19,7 m³/s
- 28.05.2006 Abfluss: 18,5 m³/s
| Date | Mean value [m³/s] | Maximum [m³/s] | Minimum [m³/s] |
|---|---|---|---|
| 16.08.2023 | 0.235 | 0.254 | 0.149 |
| 15.08.2023 | 0.251 | 0.271 | 0.238 |
| 14.08.2023 | 0.269 | 0.288 | 0.238 |
| 13.08.2023 | 0.282 | 0.307 | 0.271 |
| 12.08.2023 | 0.276 | 0.307 | 0.254 |
| 11.08.2023 | 0.295 | 0.325 | 0.271 |
| 10.08.2023 | 0.373 | 0.433 | 0.307 |
© Bayerisches Landesamt für Umwelt 2024